November 2009 - Nordea Bank Lietuva
November 2009 - Nordea Bank Lietuva
November 2009 - Nordea Bank Lietuva

You also want an ePaper? Increase the reach of your titles
YUMPU automatically turns print PDFs into web optimized ePapers that Google loves.
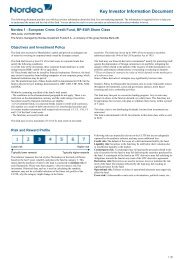
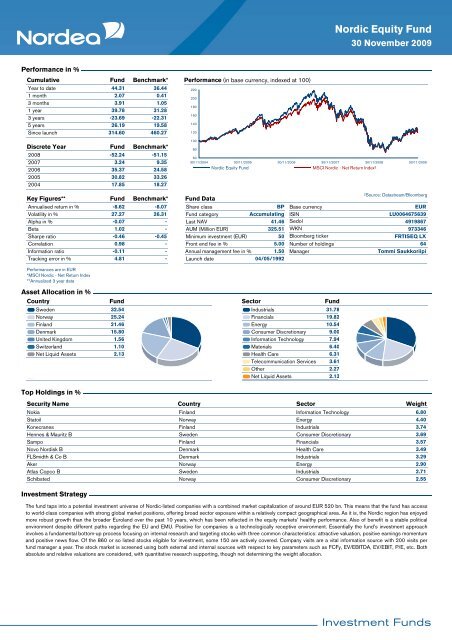
Nordic Equity Fund<br />
30 <strong>November</strong> <strong>2009</strong><br />
Performance in %<br />
Cumulative Fund Benchmark*<br />
Year to date<br />
44.31<br />
36.44<br />
1 month<br />
2.07<br />
0.41<br />
3 months<br />
3.91<br />
1.05<br />
1 year<br />
39.78<br />
31.28<br />
3 years<br />
-23.69<br />
-22.31<br />
5 years<br />
26.19<br />
19.58<br />
Since launch<br />
314.60 460.27<br />
Discrete Year<br />
2008<br />
2007<br />
2006<br />
2005<br />
2004<br />
Fund<br />
-52.24<br />
3.24<br />
35.37<br />
30.82<br />
17.85<br />
Benchmark*<br />
-51.15<br />
9.35<br />
24.58<br />
33.26<br />
18.27<br />
Performance (in base currency, indexed at 100)<br />
220<br />
200<br />
180<br />
160<br />
140<br />
120<br />
100<br />
80<br />
60<br />
30/11/2004 30/11/2005 30/11/2006 30/11/2007 30/11/2008 30/11/<strong>2009</strong><br />
Nordic Equity Fund<br />
MSCI Nordic - Net Return Index²<br />
Key Figures**<br />
Annualised return in %<br />
Volatility in %<br />
Alpha in %<br />
Beta<br />
Sharpe ratio<br />
Correlation<br />
Information ratio<br />
Tracking error in %<br />
Fund<br />
-8.62<br />
27.27<br />
-0.07<br />
1.02<br />
-0.46<br />
0.98<br />
-0.11<br />
4.81<br />
Benchmark*<br />
-8.07<br />
26.31<br />
-<br />
-<br />
-0.45<br />
Fund Data<br />
Share class<br />
Fund category<br />
Last NAV<br />
AUM (Million EUR)<br />
Minimum investment (EUR)<br />
- Front end fee in %<br />
- Annual management fee in %<br />
- Launch date<br />
BP<br />
Accumulating<br />
41.46<br />
325.51<br />
50<br />
5.00<br />
1.50<br />
04/05/1992<br />
Base currency<br />
ISIN<br />
Sedol<br />
WKN<br />
Bloomberg ticker<br />
Number of holdings<br />
Manager<br />
²Source: Datastream/Bloomberg<br />
EUR<br />
LU0064675639<br />
4919867<br />
973346<br />
FRTISEQ LX<br />
64<br />
Tommi Saukkoriipi<br />
Performances are in EUR<br />
*MSCI Nordic - Net Return Index<br />
**Annualized 3 year data<br />
Asset Allocation in %<br />
Country<br />
Fund<br />
Sweden 32.54<br />
Norway 25.24<br />
Finland 21.46<br />
Denmark 15.80<br />
United Kingdom 1.56<br />
Switzerland 1.10<br />
Net Liquid Assets 2.13<br />
Sector<br />
Fund<br />
Industrials 31.78<br />
Financials 19.82<br />
Energy 10.54<br />
Consumer Discretionary 9.00<br />
Information Technology 7.94<br />
Materials 6.40<br />
Health Care 6.31<br />
Telecommunication Services 3.61<br />
Other 2.27<br />
Net Liquid Assets 2.13<br />
Top Holdings in %<br />
Security Name Country<br />
Sector Weight<br />
Nokia Finland<br />
Information Technology<br />
6.80<br />
Statoil Norway<br />
Energy<br />
4.40<br />
Konecranes Finland<br />
Industrials<br />
3.74<br />
Hennes & Mauritz B Sweden<br />
Consumer Discretionary<br />
3.69<br />
Sampo Finland<br />
Financials<br />
3.57<br />
Novo Nordisk B Denmark<br />
Health Care<br />
3.49<br />
FLSmidth & Co B Denmark<br />
Industrials<br />
3.29<br />
Aker Norway<br />
Energy<br />
2.90<br />
Atlas Copco B Sweden<br />
Industrials<br />
2.71<br />
Schibsted Norway<br />
Consumer Discretionary<br />
2.55<br />
Investment Strategy<br />
The fund taps into a potential investment universe of Nordic-listed companies with a combined market capitalization of around EUR 520 bn. This means that the fund has access<br />
to world-class companies with strong global market positions, offering broad sector exposure within a relatively compact geographical area. As it is, the Nordic region has enjoyed<br />
more robust growth than the broader Euroland over the past 10 years, which has been reflected in the equity markets’ healthy performance. Also of benefit is a stable political<br />
environment despite different paths regarding the EU and EMU. Positive for companies is a technologically receptive environment. Essentially the fund’s investment approach<br />
involves a fundamental bottom-up process focusing on internal research and targeting stocks with three common characteristics: attractive valuation, positive earnings momentum<br />
and positive news flow. Of the 860 or so listed stocks eligible for investment, some 150 are actively covered. Company visits are a vital information source with 200 visits per<br />
fund manager a year. The stock market is screened using both external and internal sources with respect to key parameters such as FCFy, EV/EBITDA, EV/EBIT, P/E, etc. Both<br />
absolute and relative valuations are considered, with quantitative research supporting, though not determining the weight allocation.