November 2009 - Nordea Bank Lietuva
November 2009 - Nordea Bank Lietuva
November 2009 - Nordea Bank Lietuva

You also want an ePaper? Increase the reach of your titles
YUMPU automatically turns print PDFs into web optimized ePapers that Google loves.
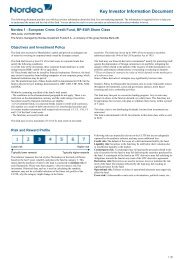
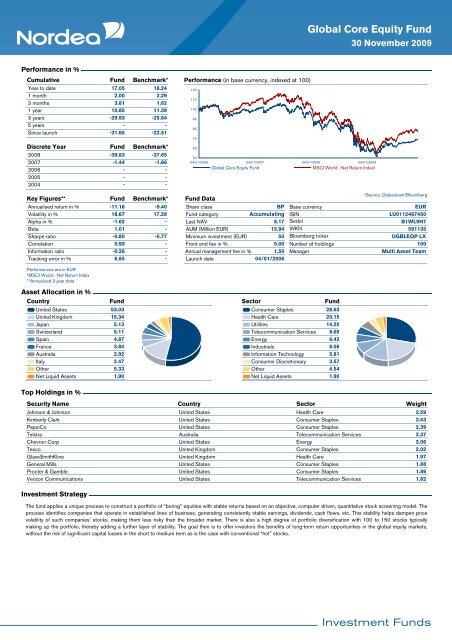
Global Core Equity Fund<br />
30 <strong>November</strong> <strong>2009</strong><br />
Performance in %<br />
Cumulative Fund Benchmark*<br />
Year to date<br />
17.05<br />
18.24<br />
1 month<br />
2.00<br />
2.29<br />
3 months<br />
3.81<br />
1.62<br />
1 year<br />
10.85<br />
11.39<br />
3 years<br />
-29.93<br />
-25.64<br />
5 years<br />
-<br />
-<br />
Since launch<br />
-31.65<br />
-22.51<br />
Discrete Year<br />
2008<br />
2007<br />
2006<br />
2005<br />
2004<br />
Fund<br />
-39.83<br />
-1.44<br />
-<br />
-<br />
-<br />
Benchmark*<br />
-37.65<br />
-1.66<br />
-<br />
-<br />
-<br />
Performance (in base currency, indexed at 100)<br />
120<br />
110<br />
100<br />
90<br />
80<br />
70<br />
60<br />
50<br />
04/01/2006 04/01/2007 04/01/2008 04/01/<strong>2009</strong><br />
Global Core Equity Fund<br />
MSCI World - Net Return Index²<br />
Key Figures**<br />
Annualised return in %<br />
Volatility in %<br />
Alpha in %<br />
Beta<br />
Sharpe ratio<br />
Correlation<br />
Information ratio<br />
Tracking error in %<br />
Fund<br />
-11.18<br />
18.67<br />
-1.62<br />
1.01<br />
-0.80<br />
0.93<br />
-0.26<br />
6.85<br />
Benchmark*<br />
-9.40<br />
17.28<br />
-<br />
-<br />
-0.77<br />
Fund Data<br />
Share class<br />
Fund category<br />
Last NAV<br />
AUM (Million EUR)<br />
Minimum investment (EUR)<br />
- Front end fee in %<br />
- Annual management fee in %<br />
- Launch date<br />
BP<br />
Accumulating<br />
8.17<br />
15.94<br />
50<br />
5.00<br />
1.50<br />
04/01/2006<br />
Base currency<br />
ISIN<br />
Sedol<br />
WKN<br />
Bloomberg ticker<br />
Number of holdings<br />
Manager<br />
²Source: Datastream/Bloomberg<br />
EUR<br />
LU0112467450<br />
B1WL9H7<br />
591135<br />
UGBLEQP LX<br />
100<br />
Multi Asset Team<br />
Performances are in EUR<br />
*MSCI World - Net Return Index<br />
**Annualized 3 year data<br />
Asset Allocation in %<br />
Country<br />
Fund<br />
United States 53.03<br />
United Kingdom 15.34<br />
Japan 5.13<br />
Switzerland 5.11<br />
Spain 4.87<br />
France 3.84<br />
Australia 2.92<br />
Italy 2.47<br />
Other 5.33<br />
Net Liquid Assets 1.90<br />
Sector<br />
Fund<br />
Consumer Staples 28.63<br />
Health Care 20.15<br />
Utilities 14.20<br />
Telecommunication Services 8.69<br />
Energy 6.42<br />
Industrials 6.06<br />
Information Technology 5.81<br />
Consumer Discretionary 3.57<br />
Other 4.54<br />
Net Liquid Assets 1.90<br />
Top Holdings in %<br />
Security Name Country<br />
Sector Weight<br />
Johnson & Johnson United States<br />
Health Care<br />
2.59<br />
Kimberly-Clark United States<br />
Consumer Staples<br />
2.43<br />
PepsiCo United States<br />
Consumer Staples<br />
2.39<br />
Telstra Australia<br />
Telecommunication Services<br />
2.37<br />
Chevron Corp United States<br />
Energy<br />
2.06<br />
Tesco United Kingdom<br />
Consumer Staples<br />
2.02<br />
GlaxoSmithKline United Kingdom<br />
Health Care<br />
1.97<br />
General Mills United States<br />
Consumer Staples<br />
1.88<br />
Procter & Gamble United States<br />
Consumer Staples<br />
1.86<br />
Verizon Communications United States<br />
Telecommunication Services<br />
1.82<br />
Investment Strategy<br />
The fund applies a unique process to construct a portfolio of “boring” equities with stable returns based on an objective, computer driven, quantitative stock screening model. The<br />
process identifies companies that operate in established lines of business, generating consistently stable earnings, dividends, cash flows, etc. This stability helps dampen price<br />
volatility of such companies’ stocks, making them less risky than the broader market. There is also a high degree of portfolio diversification with 100 to 150 stocks typically<br />
making up the portfolio, thereby adding a further layer of stability. The goal then is to offer investors the benefits of long-term return opportunities in the global equity markets,<br />
without the risk of significant capital losses in the short to medium term as is the case with conventional “hot” stocks.