November 2009 - Nordea Bank Lietuva
November 2009 - Nordea Bank Lietuva
November 2009 - Nordea Bank Lietuva

Create successful ePaper yourself
Turn your PDF publications into a flip-book with our unique Google optimized e-Paper software.
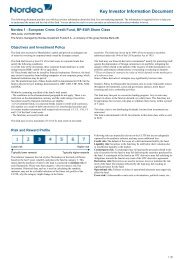
US-Dollar Reserve<br />
30 <strong>November</strong> <strong>2009</strong><br />
Performance in %<br />
Cumulative Fund Benchmark*<br />
Year to date<br />
10.78<br />
0.15<br />
1 month<br />
0.55<br />
0.00<br />
3 months<br />
3.52<br />
0.02<br />
1 year<br />
10.11<br />
0.15<br />
3 years<br />
0.82<br />
6.58<br />
5 years<br />
8.19<br />
15.16<br />
Since launch<br />
47.00<br />
50.63<br />
Performance (in base currency, indexed at 100)<br />
116<br />
112<br />
108<br />
104<br />
100<br />
Discrete Year<br />
2008<br />
2007<br />
2006<br />
2005<br />
2004<br />
Fund<br />
-12.24<br />
3.28<br />
4.58<br />
2.86<br />
0.69<br />
Benchmark*<br />
1.41<br />
4.54<br />
4.89<br />
3.22<br />
1.40<br />
96<br />
92<br />
30/11/2004 30/11/2005 30/11/2006 30/11/2007 30/11/2008 30/11/<strong>2009</strong><br />
US-Dollar Reserve<br />
US Treasury Bill Second Market 3m - TR²<br />
Key Figures**<br />
Annualised return in %<br />
Volatility in %<br />
Average maturity<br />
Duration in years<br />
Yield to maturity<br />
Correlation<br />
Information ratio<br />
Tracking error in %<br />
Fund<br />
0.27<br />
5.86<br />
2.09<br />
1.41<br />
2.72<br />
0.03<br />
-0.32<br />
5.86<br />
Benchmark*<br />
2.15<br />
0.60<br />
-<br />
-<br />
-<br />
Fund Data<br />
Share class<br />
Fund category<br />
Last NAV<br />
AUM (Million USD)<br />
Minimum investment (EUR)<br />
- Front end fee in %<br />
- Annual management fee in %<br />
- Launch date<br />
BP<br />
Accumulating<br />
14.70<br />
12.09<br />
50<br />
1.00<br />
0.13<br />
14/03/1997<br />
Base currency<br />
ISIN<br />
Sedol<br />
WKN<br />
Bloomberg ticker<br />
Number of holdings<br />
Manager<br />
²Source: Datastream/Bloomberg<br />
USD<br />
LU0076316180<br />
5229071<br />
986883<br />
FROUSDR LX<br />
18<br />
Fixed Income Corporate Team<br />
Performances are in USD<br />
*US Treasury Bill Second Market 3m - TR<br />
**Annualized 3 year data<br />
Asset Allocation in %<br />
Country<br />
Fund<br />
United States 47.81<br />
United Kingdom 15.84<br />
Ireland 13.36<br />
France 4.11<br />
Australia 4.01<br />
Sweden 3.92<br />
Jersey 3.75<br />
Net Liquid Assets 7.16<br />
Asset Type<br />
Fund<br />
Corporate Bonds 80.37<br />
Government Bonds 12.46<br />
Net Liquid Assets 7.16<br />
Top Holdings in %<br />
Security Name<br />
Country<br />
Asset Type<br />
Weight<br />
US Treasury 0.875% 2011-01-31 United States<br />
Corporate Bonds<br />
12.48<br />
US Treasury 3.625% 2010-01-15 United States<br />
Government Bonds<br />
12.46<br />
American General Finance FRN 2011-08-17 United States<br />
Corporate Bonds<br />
6.70<br />
Allied Irish <strong>Bank</strong>s FRN 2015-07-30 Ireland<br />
Corporate Bonds<br />
5.55<br />
Credit Suisse USA FRN 2010-01-15 United States<br />
Corporate Bonds<br />
4.12<br />
Irish Life & Permanent FRN 2010-05-25 Ireland<br />
Corporate Bonds<br />
4.11<br />
Banque Fed Cred FRN 2011-09-20 France<br />
Corporate Bonds<br />
4.11<br />
Portman Bulding Society FRN 2010-10-18 United Kingdom<br />
Corporate Bonds<br />
4.11<br />
Morgan Stanley FRN 2011-01-18 United States<br />
Corporate Bonds<br />
4.08<br />
Aust & Nz <strong>Bank</strong>ing Grp FRN 2015-04-28 Australia<br />
Corporate Bonds<br />
4.01<br />
Investment Strategy<br />
The fund invests a minimum of two-thirds of its net assets in fixed-income and floating rate debt securities issued by private borrowers and public authorities. The strategy is to<br />
invest mainly in USD, CAD, AUD or NZD denominated short-term bonds and other short-term transferable debt securities listed on a stock Exchange in the United States of<br />
America, Canada, Australia, New Zealand or traded in another regulated market within the OECD.