November 2009 - Nordea Bank Lietuva
November 2009 - Nordea Bank Lietuva
November 2009 - Nordea Bank Lietuva

You also want an ePaper? Increase the reach of your titles
YUMPU automatically turns print PDFs into web optimized ePapers that Google loves.
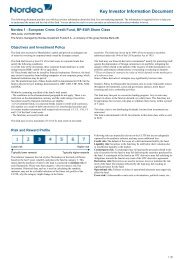
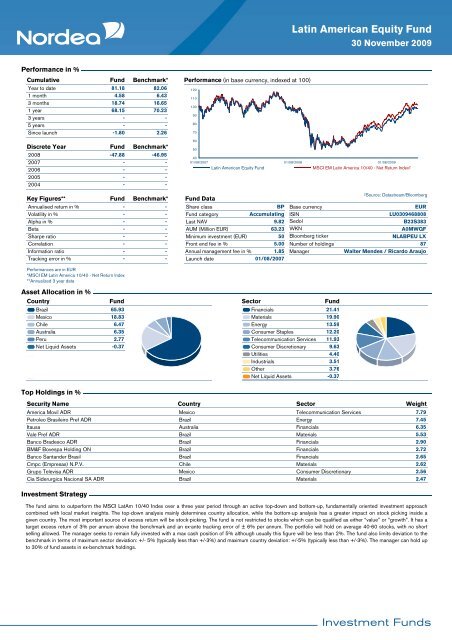
Latin American Equity Fund<br />
30 <strong>November</strong> <strong>2009</strong><br />
Performance in %<br />
Cumulative Fund Benchmark*<br />
Year to date<br />
81.18<br />
82.06<br />
1 month<br />
4.58<br />
6.43<br />
3 months<br />
18.74<br />
16.65<br />
1 year<br />
68.15<br />
70.23<br />
3 years<br />
-<br />
-<br />
5 years<br />
-<br />
-<br />
Since launch<br />
-1.80<br />
2.26<br />
Discrete Year<br />
2008<br />
2007<br />
2006<br />
2005<br />
2004<br />
Fund<br />
-47.88<br />
-<br />
-<br />
-<br />
-<br />
Benchmark*<br />
-46.95<br />
-<br />
-<br />
-<br />
-<br />
Performance (in base currency, indexed at 100)<br />
120<br />
110<br />
100<br />
90<br />
80<br />
70<br />
60<br />
50<br />
40<br />
01/08/2007 01/08/2008 01/08/<strong>2009</strong><br />
Latin American Equity Fund<br />
MSCI EM Latin America 10/40 - Net Return Index²<br />
Key Figures**<br />
Annualised return in %<br />
Volatility in %<br />
Alpha in %<br />
Beta<br />
Sharpe ratio<br />
Correlation<br />
Information ratio<br />
Tracking error in %<br />
Fund<br />
-<br />
-<br />
-<br />
-<br />
-<br />
-<br />
-<br />
-<br />
Benchmark*<br />
-<br />
-<br />
-<br />
-<br />
-<br />
Fund Data<br />
Share class<br />
Fund category<br />
Last NAV<br />
AUM (Million EUR)<br />
Minimum investment (EUR)<br />
- Front end fee in %<br />
- Annual management fee in %<br />
- Launch date<br />
BP<br />
Accumulating<br />
9.82<br />
63.23<br />
50<br />
5.00<br />
1.85<br />
01/08/2007<br />
Base currency<br />
ISIN<br />
Sedol<br />
WKN<br />
Bloomberg ticker<br />
Number of holdings<br />
Manager<br />
²Source: Datastream/Bloomberg<br />
EUR<br />
LU0309468808<br />
B23S383<br />
A0MWQF<br />
NLABPEU LX<br />
87<br />
Walter Mendes / Ricardo Araujo<br />
Performances are in EUR<br />
*MSCI EM Latin America 10/40 - Net Return Index<br />
**Annualized 3 year data<br />
Asset Allocation in %<br />
Country<br />
Fund<br />
Brazil 65.93<br />
Mexico 18.83<br />
Chile 6.47<br />
Australia 6.35<br />
Peru 2.77<br />
Net Liquid Assets -0.37<br />
Sector<br />
Fund<br />
Financials 21.41<br />
Materials 19.90<br />
Energy 13.59<br />
Consumer Staples 12.20<br />
Telecommunication Services 11.93<br />
Consumer Discretionary 9.63<br />
Utilities 4.40<br />
Industrials 3.51<br />
Other 3.76<br />
Net Liquid Assets -0.37<br />
Top Holdings in %<br />
Security Name Country<br />
Sector Weight<br />
America Movil ADR Mexico<br />
Telecommunication Services<br />
7.79<br />
Petroleo Brasileiro Pref ADR Brazil<br />
Energy<br />
7.45<br />
Itausa Australia<br />
Financials<br />
6.35<br />
Vale Pref ADR Brazil<br />
Materials<br />
5.53<br />
Banco Bradesco ADR Brazil<br />
Financials<br />
2.90<br />
BM&F Bovespa Holding ON Brazil<br />
Financials<br />
2.72<br />
Banco Santander Brasil Brazil<br />
Financials<br />
2.65<br />
Cmpc (Empresas) N.P.V. Chile<br />
Materials<br />
2.62<br />
Grupo Televisa ADR Mexico<br />
Consumer Discretionary<br />
2.56<br />
Cia Siderurgica Nacional SA ADR Brazil<br />
Materials<br />
2.47<br />
Investment Strategy<br />
The fund aims to outperform the MSCI LatAm 10/40 Index over a three year period through an active top-down and bottom-up, fundamentally oriented investment approach<br />
combined with local market insights. The top-down analysis mainly determines country allocation, while the bottom-up analysis has a greater impact on stock picking inside a<br />
given country. The most important source of excess return will be stock-picking. The fund is not restricted to stocks which can be qualified as either “value” or “growth”. It has a<br />
target excess return of 3% per annum above the benchmark and an ex-ante tracking error of ± 6% per annum. The portfolio will hold on average 40-60 stocks, with no short<br />
selling allowed. The manager seeks to remain fully invested with a max cash position of 5% although usually this figure will be less than 2%. The fund also limits deviation to the<br />
benchmark in terms of maximum sector deviation: +/- 5% (typically less than +/-3%) and maximum country deviation: +/-5% (typically less than +/-3%). The manager can hold up<br />
to 30% of fund assets in ex-benchmark holdings.