2010-2015 Strategic Plan - Department of Public Works
2010-2015 Strategic Plan - Department of Public Works
2010-2015 Strategic Plan - Department of Public Works

You also want an ePaper? Increase the reach of your titles
YUMPU automatically turns print PDFs into web optimized ePapers that Google loves.
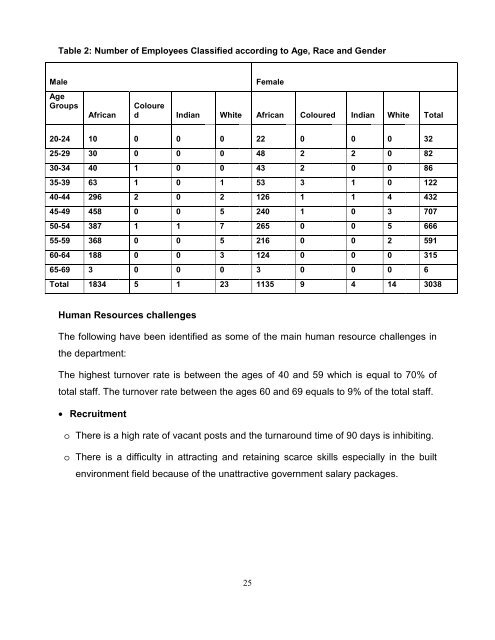
Table 2: Number <strong>of</strong> Employees Classified according to Age, Race and Gender<br />
Male<br />
Age<br />
Groups<br />
African<br />
Female<br />
Coloure<br />
d Indian White African Coloured Indian White Total<br />
20-24 10 0 0 0 22 0 0 0 32<br />
25-29 30 0 0 0 48 2 2 0 82<br />
30-34 40 1 0 0 43 2 0 0 86<br />
35-39 63 1 0 1 53 3 1 0 122<br />
40-44 296 2 0 2 126 1 1 4 432<br />
45-49 458 0 0 5 240 1 0 3 707<br />
50-54 387 1 1 7 265 0 0 5 666<br />
55-59 368 0 0 5 216 0 0 2 591<br />
60-64 188 0 0 3 124 0 0 0 315<br />
65-69 3 0 0 0 3 0 0 0 6<br />
Total 1834 5 1 23 1135 9 4 14 3038<br />
Human Resources challenges<br />
The following have been identified as some <strong>of</strong> the main human resource challenges in<br />
the department:<br />
The highest turnover rate is between the ages <strong>of</strong> 40 and 59 which is equal to 70% <strong>of</strong><br />
total staff. The turnover rate between the ages 60 and 69 equals to 9% <strong>of</strong> the total staff.<br />
• Recruitment<br />
o There is a high rate <strong>of</strong> vacant posts and the turnaround time <strong>of</strong> 90 days is inhibiting.<br />
o There is a difficulty in attracting and retaining scarce skills especially in the built<br />
environment field because <strong>of</strong> the unattractive government salary packages.<br />
25