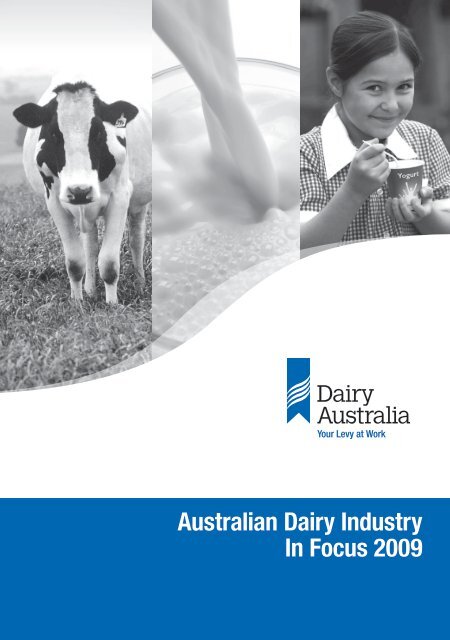
Australian Dairy Industry In Focus 2009 - Dairying For Tomorrow
Australian Dairy Industry In Focus 2009 - Dairying For Tomorrow
Australian Dairy Industry In Focus 2009 - Dairying For Tomorrow

Create successful ePaper yourself
Turn your PDF publications into a flip-book with our unique Google optimized e-Paper software.
<strong>Australian</strong> <strong>Dairy</strong> <strong><strong>In</strong>dustry</strong><br />
<strong>In</strong> <strong>Focus</strong> <strong>2009</strong>
<strong>Australian</strong> dairy at a glance (2008/09)<br />
Table 1<br />
National dairy herd<br />
Average herd size<br />
Milk production<br />
Average annual milk<br />
production per cow<br />
<strong>Dairy</strong> – Australia’s third<br />
largest rural industry<br />
<strong>Dairy</strong> – major value-added<br />
food industry<br />
1.6 million cows<br />
200 cows<br />
9,388 million litres<br />
5,750 litres<br />
$4.0 billion value at farmgate<br />
$12 billion value at wholesale<br />
Milk utilisation Cheese 33%<br />
Drinking milk 24%<br />
SMP/butter 25%<br />
WMP 12%<br />
Casein/butter 4%<br />
Other 2%<br />
Production of main<br />
commodities (tonnes)<br />
Milk powders 359,600<br />
Cheese 342,000<br />
Butter (CBE) 148,500<br />
<strong>Dairy</strong> – major export industry<br />
Percentage of Aust milk<br />
production – exported<br />
Major markets for <strong>Australian</strong><br />
dairy products – (tonnes)<br />
$2.9 billion<br />
9% of world dairy trade<br />
45%<br />
Australia 2,604,000<br />
(including 2,178,600 of<br />
drinking milk)<br />
Japan 106,000<br />
Singapore 76,300<br />
Malaysia 80,000<br />
China 61,300<br />
Philippines 50,000<br />
Per capita consumption Drinking milk 104Lts<br />
Cheese<br />
12kg<br />
<strong>Dairy</strong> industry workforce Direct employment of<br />
approximately 40,000<br />
ABARE estimates a regional economic multiplier of<br />
2.5 from the dairy industry<br />
Abbreviations<br />
ABARE <strong>Australian</strong> Bureau of Agricultural<br />
and Resource Economics<br />
ABS <strong>Australian</strong> Bureau of Statistics<br />
ADC <strong>Australian</strong> <strong>Dairy</strong> Corporation<br />
AMF Anhydrous milk fat<br />
AUST Australia<br />
BMP Buttermilk powder<br />
CAGR Compound annual growth rate<br />
CBE Commercial butter equivalent, a unit of conversion<br />
of AMF to butter (1kg butter = 0.805kg AMF)<br />
cpl Cents per litre<br />
(e) Estimated data<br />
DA <strong>Dairy</strong> Australia<br />
EU European Union<br />
EU (15) European Union – original 15 member states<br />
EU (10) Additional 10 accession countries – since May 2004<br />
FNQ Far north Queensland<br />
Gps Gippsland<br />
n.a. Data not available<br />
NCE Natural cheddar equivalent – unit of conversion<br />
of processed cheddar, pastes and spreads to natural<br />
cheddar (1kg processed product weight =<br />
0.806kg natural cheddar)<br />
NDFS National <strong>Dairy</strong> Farmers’ Survey <strong>2009</strong><br />
NV Northern Victoria/NSW Riverina<br />
(p) Provisional data<br />
(r) Revised data<br />
SEQ South-east Queensland/north-east New South Wales<br />
SMP Skim milk powder<br />
SNF Solids non fat<br />
UHT Milk subjected to ultra high temperature treatment<br />
to extend shelf life<br />
WMP Wholemilk powder<br />
WPC Whey protein concentrate<br />
WV Western Victoria<br />
Published by <strong>Dairy</strong> Australia.<br />
<strong>Australian</strong> <strong>Dairy</strong> <strong><strong>In</strong>dustry</strong> <strong>In</strong> <strong>Focus</strong> <strong>2009</strong> is published for the information of readers only. The information in this report<br />
is published with due care and attention to its accuracy, but <strong>Dairy</strong> Australia accepts no liability if, for any reason, the<br />
information is inaccurate, incomplete or out of date. You may copy and distribute parts of this report, provided that it is not for<br />
commercial use and you acknowledge <strong>Dairy</strong> Australia as the information provider.<br />
© Copyright <strong>Dairy</strong> Australia <strong>2009</strong>. All rights reserved.<br />
ISSN 1448-9392<br />
Designgrant/Geon/<strong>2009</strong>
Contents<br />
<strong>For</strong>eword ................................................................................. 2<br />
<strong>Dairy</strong> <strong>2009</strong>: Situation & Outlook ........................................................... 3<br />
The <strong>Australian</strong> dairy industry .............................................................. 9<br />
Farm facts ............................................................................... 11<br />
Milk production .......................................................................... 17<br />
<strong>Dairy</strong> manufacturing ...................................................................... 21<br />
<strong>Dairy</strong> markets ............................................................................ 22<br />
<strong>Australian</strong> consumption of dairy products ................................................. 24<br />
Drinking milk ............................................................................. 25<br />
Cheese .................................................................................. 27<br />
Butter .................................................................................... 28<br />
Fresh and frozen dairy products .......................................................... 29<br />
Milk powders ............................................................................ 30<br />
Whey products and casein ................................................................ 32<br />
<strong><strong>In</strong>dustry</strong> organisations and structure ...................................................... 33<br />
<strong><strong>In</strong>dustry</strong> levies ........................................................................... 36<br />
Appendices<br />
1. Regions ............................................................................... 38<br />
2. Milk production ....................................................................... 39<br />
3. Manufacturing processes ............................................................. 40<br />
4. Supermarket sales .................................................................... 43<br />
5. Exports ............................................................................... 46<br />
6. Imports ............................................................................... 51<br />
<strong>In</strong>dex .................................................................................... 52<br />
<strong>Dairy</strong> Australia has collected the statistics in this publication from <strong>Australian</strong> dairy companies and other <strong>Australian</strong> dairy<br />
organisations (except where other sources are indicated).<br />
<strong>Australian</strong> <strong>Dairy</strong> <strong><strong>In</strong>dustry</strong> <strong>In</strong> <strong>Focus</strong> <strong>2009</strong> 1
<strong>For</strong>eword<br />
Australia’s dairy industry is one<br />
of the three most important rural<br />
industries, with a farmgate value<br />
of $4.0 billion in 2008/09. <strong>Dairy</strong><br />
ranks fourth in agricultural<br />
exports valued at $2.9 billion.<br />
Export volumes increased 6%<br />
in 2008/09, reflecting improved<br />
availability of product for<br />
sale, but lower world dairy<br />
Mike Ginnivan commodity prices meant that<br />
Managing Director export returns increased just<br />
<strong>Dairy</strong> Australia<br />
1.5% over the year. <strong>In</strong> the local<br />
market, supermarket sales of dairy products<br />
continued to increase in both volume and<br />
value – with the retail value of the major<br />
dairy categories increasing by nearly 10% for<br />
a second consecutive year to more than $4.9<br />
billion in 2008/09.<br />
Milk production increased 2% during<br />
2008/09 to 9.4 billion litres, under the<br />
influence of generally benign conditions<br />
across most coastal dairying regions.<br />
However, the inland irrigated regions of the<br />
lower Murray-Darling Basin continued<br />
to experience significantly reduced water<br />
allocations and a steadily reducing herd<br />
size. <strong>For</strong> many farmers in this region, the<br />
international market downturn and its<br />
impact on milk prices has forced many<br />
of them to completely reassess their situation<br />
and make difficult decisions around<br />
continuing to farm, relocating or exiting<br />
the industry.<br />
Farmgate milk prices had reached record<br />
highs in 2007/08 and, despite falling 15%<br />
during 2008/09, were still well above those<br />
of previous seasons. However, the collapse<br />
in world dairy commodity prices during<br />
2008 saw the almost unprecedented event<br />
of a step-down in milk prices during the<br />
season for the 75% of <strong>Australian</strong> dairy<br />
farmers who supply exporting companies.<br />
Milk prices for the <strong>2009</strong>/10 season opened<br />
at levels not seen for five years and well<br />
below those of the recent past. These events<br />
have significantly shaken farmers’ shortterm<br />
confidence in the industry.<br />
Nevertheless, confidence in the medium<br />
to long-term prospects for the industry has<br />
remained relatively strong as measured<br />
in the National <strong>Dairy</strong> Farmer Survey of <strong>2009</strong>;<br />
and this was confirmed in a recent<br />
follow-up survey. The feature article<br />
will follow the trend set last year and<br />
provide an October Update to the annual<br />
<strong>Dairy</strong> <strong>2009</strong>: Situation & Outlook report.<br />
This year marks the sixth edition of this<br />
annual industry report, which provides<br />
a comprehensive overview of the <strong>Australian</strong><br />
and global dairy scene.<br />
<strong>Dairy</strong> Australia is the industry’s farmerowned<br />
service organisation. Funded<br />
by farmer levies, with matching research<br />
and development funds from the <strong>Australian</strong><br />
Government, <strong>Dairy</strong> Australia’s role is to<br />
boost the long-term sustainability and<br />
viability of local farm businesses and the<br />
regional communities that depend on the<br />
dairy industry. The organisation works<br />
across the dairy supply chain in areas that<br />
benefit the entire industry – from farming<br />
through manufacturing, to domestic and<br />
export markets. More detail on the objectives<br />
and the way <strong>Dairy</strong> Australia interacts with<br />
the other industry organisations is available<br />
in the <strong><strong>In</strong>dustry</strong> Organisations and Structure<br />
section on page 33.<br />
I would like to extend <strong>Dairy</strong> Australia’s<br />
thanks to the dairy farmer co-operatives and<br />
companies that contribute to our regular<br />
data collections. Without their participation,<br />
<strong>Australian</strong> <strong>Dairy</strong> <strong><strong>In</strong>dustry</strong> <strong>In</strong> <strong>Focus</strong> could<br />
not maintain its reputation as the most<br />
comprehensive and credible collection<br />
of <strong>Australian</strong> dairy industry statistics<br />
available. Regular monthly updates of much<br />
of the industry production data included<br />
in this publication are available from<br />
www.dairyaustralia.com.au. The website<br />
also features <strong>Dairy</strong> <strong>2009</strong>: Situation & Outlook,<br />
together with the October <strong>2009</strong> Update.<br />
I trust you will find that this latest issue<br />
of <strong>Australian</strong> <strong>Dairy</strong> <strong><strong>In</strong>dustry</strong> <strong>In</strong> <strong>Focus</strong> remains<br />
a valuable source of knowledge and<br />
information on this important industry.<br />
2<br />
<strong>Australian</strong> <strong>Dairy</strong> <strong><strong>In</strong>dustry</strong> <strong>In</strong> <strong>Focus</strong> <strong>2009</strong>
<strong>Dairy</strong> <strong>2009</strong>: Situation & Outlook<br />
Background<br />
The Situation & Outlook report is prepared<br />
each year to provide a clear and timely<br />
picture of what is happening in the<br />
<strong>Australian</strong> dairy industry, key drivers<br />
of the industry, and expectations for the<br />
future. It draws on the National <strong>Dairy</strong><br />
Farmer Survey results, plus the views<br />
and opinions of global dairy market<br />
analysts, retail analysts, dairy company<br />
management, farm consultants and<br />
farm leaders.<br />
As well as informing farmers, the report<br />
aims to provide factual insights into<br />
dairy for banks, governments, regional<br />
communities and suppliers of products<br />
and services to the dairy industry.<br />
The annual Situation & Outlook report<br />
was published in June, with an update<br />
released in October.<br />
The industry in October <strong>2009</strong><br />
Unprecedented volatility in the<br />
international market associated with<br />
the global financial crisis and resultant<br />
economic downturn has had a severe<br />
impact on both farmer finances and<br />
confidence in the <strong>Australian</strong> dairy<br />
industry in the past year.<br />
Falling commodity prices during 2008<br />
and early-<strong>2009</strong> translated rapidly into<br />
lower farmgate prices with a 1-in-35 year<br />
step-down in milk price taking effect<br />
from February this year across southern<br />
dairying regions.<br />
The financial impact was severe as many<br />
farmers, through climate-related necessity<br />
and facilitated by the previous higher<br />
farmgate prices, found themselves locked<br />
into production systems with limited<br />
cost flexibility.<br />
<strong>Australian</strong> dairy farmers are currently<br />
facing the difficult challenge of managing<br />
tight cash flow with highly variable spring<br />
conditions. The lowest opening farmgate<br />
milk prices for five years mean that many<br />
dairy farmers are currently operating<br />
at or below break-even levels, despite<br />
grain prices falling to levels not seen for<br />
several years.<br />
An estimated 95% of farmers surveyed<br />
in early-September have seen their<br />
farmgate price significantly reduced<br />
in <strong>2009</strong>. Farmers have implemented<br />
multiple strategies in response – the<br />
main ones being restructuring debt<br />
(43%), reducing herd numbers (37%) and<br />
reducing the amount of supplementary<br />
feed provided (34%).<br />
Figure 1<br />
Surveyed spot prices of <strong>Australian</strong> exporters<br />
$6,000<br />
Butter<br />
$5,000<br />
SMP<br />
WMP<br />
$4,000<br />
Cheddar<br />
$US/Tonne<br />
$3,000<br />
$2,000<br />
$1,000<br />
$0<br />
Jan 05<br />
Apr 05<br />
Jul 05<br />
Oct 05<br />
Jan 06<br />
Apr 06<br />
Jul 06<br />
Oct 06<br />
Jan 07<br />
Apr 07<br />
Jul 07<br />
Oct 07<br />
Jan 08<br />
Apr 08<br />
Jul 08<br />
Oct 08<br />
Jan 09<br />
Apr 09<br />
Jul 09<br />
Source: <strong>Dairy</strong> Australia<br />
<strong>Australian</strong> <strong>Dairy</strong> <strong><strong>In</strong>dustry</strong> <strong>In</strong> <strong>Focus</strong> <strong>2009</strong> 3
Figure 2<br />
Estimated opening milk price to VIC / SA / TAS dairy farmers – $/kg milk solids<br />
$6.00<br />
$5.00<br />
$4.00<br />
$3.00<br />
$2.00<br />
$1.00<br />
$0.00<br />
2004/05<br />
2005/06<br />
2006/07<br />
2007/08<br />
2008/09<br />
<strong>2009</strong>/10(e)<br />
Source: <strong>Dairy</strong> Australia<br />
While farmer confidence has been affected,<br />
60% of farmers remain positive about the<br />
industry’s future. This is an encouraging<br />
result, underpinned more recently<br />
by improving market signals, easing<br />
in input costs – particularly grain – and<br />
some good mid-spring rainfall in many<br />
key dairying regions. Even irrigation<br />
allocations in northern Victoria are at fouryear<br />
highs for early-October.<br />
One of the improving market signals<br />
is that international commodity prices<br />
have increased sharply in US dollar terms<br />
over the last quarter. After running down<br />
stocks over a number of months, there are<br />
now clear signs of greater buyer activity<br />
and a greater willingness to purchase<br />
ahead of immediate requirements.<br />
While the rapid turnaround in commodity<br />
prices is good news, a recovery in demand<br />
may be prematurely burnt off by a too<br />
rapid increase in prices. Ideally, a gradual<br />
economic recovery would lead to steady<br />
improvements in dairy commodity prices<br />
and more sustainable pricing for the longer<br />
term. However, while uncertainty around<br />
a sustained global recovery remains,<br />
international dairy market conditions are<br />
likely to remain volatile.<br />
Currency movements are having a major<br />
influence on Australia’s export prospects<br />
this season. The US dollar has weakened<br />
against the <strong>Australian</strong> dollar, and most<br />
major currencies, and this has eroded<br />
returns to exporters in <strong>Australian</strong> dollars.<br />
The strength of the <strong>Australian</strong> dollar<br />
poses a major threat to improved farmgate<br />
prices in <strong>2009</strong>/10. Above the 85-cent level,<br />
each 1 cent increase in the value of the<br />
AUD leads to a decrease of about 0.4 cpl<br />
in farmgate price.<br />
<strong>For</strong>ecasts (at early-October) for the<br />
<strong>Australian</strong> dollar vary widely – from 68<br />
to 95 cents by end-2010 – with a number<br />
of financial institutions currently<br />
upgrading their forecasts. The large<br />
range continues to reflect the continued<br />
uncertainty surrounding the world<br />
economy in 2010.<br />
4<br />
<strong>Australian</strong> <strong>Dairy</strong> <strong><strong>In</strong>dustry</strong> <strong>In</strong> <strong>Focus</strong> <strong>2009</strong>
What did farmers say<br />
in September <strong>2009</strong><br />
Confidence in the future of the industry<br />
It is always difficult to ‘get the timing right’<br />
in attitude surveys as events can unfold<br />
quite quickly and affect results. The timing<br />
of the latest early-September <strong>2009</strong> survey<br />
found farmers at a low point – dealing<br />
with the reality of the 2008/09 step-down,<br />
the lowest opening farmgate prices in five<br />
years and seasonally low spring prices.<br />
Many regions had also received limited<br />
late-winter rainfall.<br />
Consequently, the percentage of farmers<br />
who were positive about the industry<br />
Figure 3<br />
Farmers’ attitude to industry future – % of farms<br />
Percentage<br />
100<br />
80<br />
60<br />
40<br />
future had fallen to 60% – from a peak<br />
of 78% in early 2008 at the peak of the<br />
international commodity price cycle.<br />
However, since the survey was conducted,<br />
many regions have received good rainfall,<br />
grain prices have continued to weaken,<br />
milk price step-ups have been announced<br />
by two major companies and market<br />
signals look increasingly positive. These<br />
developments are likely to have shifted<br />
sentiment significantly.<br />
<strong>In</strong>terestingly, survey respondents generally<br />
expressed greater confidence in their own<br />
dairy business (66% were positive) than<br />
they have in the wider local (56%) and<br />
national (60%) industry.<br />
Very<br />
positive<br />
Fairly<br />
positive<br />
Neutral/<br />
Unsure<br />
Fairly<br />
negative<br />
Very<br />
negative<br />
20<br />
0<br />
2004 2005 2006 2007 2008 <strong>2009</strong> <strong>2009</strong> (Sept)<br />
Source:<br />
NDFS <strong>2009</strong><br />
Figure 4<br />
Expected production growth in three years time – % of farms<br />
80<br />
March September Source: NDFS <strong>2009</strong><br />
60<br />
Percentage<br />
40<br />
20<br />
0<br />
Aust<br />
NV WV Gps SEQ NSW SA WA Tas<br />
<strong>Australian</strong> <strong>Dairy</strong> <strong><strong>In</strong>dustry</strong> <strong>In</strong> <strong>Focus</strong> <strong>2009</strong> 5
Expectations of growth in production<br />
The proportion of respondents expecting<br />
higher production in three years time<br />
has fallen from 61% in March to 32%<br />
in September – with growth expectations<br />
falling significantly across the key<br />
southern dairying regions.<br />
Among those who are expecting<br />
to increase production over the next<br />
three years, 33% attributed the anticipated<br />
increase to increasing herd size, 23%<br />
to seasonal improvements, 24% to feeding<br />
cows better and 19% to better genetics.<br />
Those who expected to reduce production<br />
cited more off-farm factors with the main<br />
driver being low milk price (54%).<br />
Challenges facing the local industry<br />
Milk price was (understandably) the<br />
greatest current and future challenge<br />
mentioned by farmers in <strong>2009</strong>; overtaking<br />
climate issues and the availability and<br />
cost of inputs.<br />
Figure 5<br />
Grain prices – $A/tonne<br />
500<br />
450<br />
400<br />
Barley – Vic<br />
Wheat – Vic<br />
Climate issues and the cost and availability<br />
of irrigation water were the next most often<br />
mentioned challenges – both for <strong>2009</strong> and<br />
the future.<br />
Meanwhile, the availability and cost of inputs<br />
were less of a challenge in <strong>2009</strong>. Grain<br />
costs have eased markedly in the current<br />
season with large northern hemisphere<br />
grain harvests, the strong <strong>Australian</strong> dollar<br />
pushing down international prices and<br />
greatly improved prospects for plentiful<br />
supply from a large local harvest towards<br />
the end of <strong>2009</strong>.<br />
World demand improves<br />
as economy recovers<br />
Asian countries are leading the recovery from<br />
the global economic downturn. This reflects<br />
less exposure to financial derivative products,<br />
improved banking systems following the<br />
region’s own financial crisis in the late-1990s<br />
and large fiscal stimulus packages.<br />
However, despite some positive economic<br />
signals, significant downside risks remain.<br />
Source: <strong>Australian</strong> Crop <strong>For</strong>ecasters<br />
350<br />
300<br />
$A/tonne<br />
250<br />
200<br />
150<br />
100<br />
50<br />
0<br />
Jan 05<br />
Apr 05<br />
Jul 05<br />
Oct 05<br />
Jan 06<br />
Apr 06<br />
Jul 06<br />
Oct 06<br />
Jan 07<br />
Apr 07<br />
Jul 07<br />
Oct 07<br />
Jan 08<br />
Apr 08<br />
Jul 08<br />
Oct 08<br />
Jan 09<br />
Apr 09<br />
Jul 09<br />
6<br />
<strong>Australian</strong> <strong>Dairy</strong> <strong><strong>In</strong>dustry</strong> <strong>In</strong> <strong>Focus</strong> <strong>2009</strong>
Withdrawing stimulus too early could<br />
undermine confidence and world<br />
economic growth would suffer if the<br />
economies of China or <strong>In</strong>dia were to falter.<br />
The IMF has reported economic<br />
stabilisation is uneven and that the<br />
economic recovery will be sluggish;<br />
forecasting a 1.4% contraction in <strong>2009</strong> and<br />
2.5% growth in 2010.<br />
Global organisations such as the World<br />
Bank and IMF agree that the recovery<br />
from an economic downturn caused<br />
by a financial crisis tends to be deeper and<br />
slower than a normal downturn because<br />
debt-burdened consumers will be cautious<br />
and have an on-going propensity to save<br />
more – which is expected to slow growth<br />
for several years.<br />
Given this economic outlook, the prospects<br />
for global dairy demand remain mixed,<br />
with powders likely to fare better than<br />
butter and cheese.<br />
It appears that global supply pipelines<br />
have largely been cleared and southern<br />
hemisphere manufacturers have been<br />
running down inventories over the<br />
seasonal production low. Buyers appear<br />
to be strategically purchasing product<br />
now in anticipation of a potentially<br />
limited availability in early 2010.<br />
Chinese ingredient buyers are also<br />
back in the market purchasing large<br />
volumes of powders.<br />
Nevertheless, it is unclear how much<br />
renewed demand is strategic buying<br />
now that prices are moving upwards<br />
or whether it is consumer-led demand.<br />
<strong>Australian</strong> market situation<br />
& outlook<br />
Australia is now the fastest-growing<br />
economy in the Western world – and the<br />
only Western economy to grow in the year<br />
to June <strong>2009</strong>.<br />
The <strong>Australian</strong> market continues to deliver<br />
volume and value growth with per capita<br />
consumption holding firm through<br />
2008/09 at around 300 litres in milk<br />
equivalent terms.<br />
Volume growth has returned in the<br />
cheese category in recent months however<br />
consumers have continued to move from<br />
branded to private label products in the<br />
milk category.<br />
Figure 6<br />
Supermarket growth by dairy category – six months to August <strong>2009</strong><br />
Value<br />
Cheddar<br />
Volume<br />
Source: Synovate Aztec<br />
<strong>Dairy</strong> spreads<br />
All milk<br />
Private label milk<br />
Branded milk<br />
–4% –2% 0% 2% 4% 6% 8% 10%<br />
<strong>Australian</strong> <strong>Dairy</strong> <strong><strong>In</strong>dustry</strong> <strong>In</strong> <strong>Focus</strong> <strong>2009</strong> 7
Wholesale prices have held firm across the<br />
range of dairy products. Manufacturers<br />
have tended to prioritise the domestic<br />
market, given the downturn in export<br />
returns over the past 12 months. However,<br />
there will be some careful assessment<br />
of local returns in coming months, given<br />
the strengthening of world markets.<br />
Prices in the non-grocery (foodservice<br />
and industrial) sector have followed<br />
international commodity trends more<br />
closely than grocery prices as prevailing<br />
supermarket supply contracts have limited<br />
price adjustments.<br />
Expected increases in official interest rates<br />
may reduce discretionary spending locally.<br />
While this is unlikely to affect the volume<br />
of dairy products consumed, it may<br />
impact on the channel and value of dairy<br />
sales as consumers seek to “economise”.<br />
This would tend to favour increased<br />
sales of private label products through<br />
the supermarket channel, while branded<br />
products and foodservice sales are likely<br />
to be negatively affected.<br />
World supply<br />
Signs of slowing US production and<br />
the likelihood of lower supplies from<br />
the southern hemisphere, coupled with<br />
improving demand, are bringing the<br />
international dairy market back into<br />
balance. However, EU and US government<br />
intervention and stockpiles will continue<br />
to have a negative impact on market<br />
sentiment until they are removed.<br />
<strong>In</strong> Europe, farmers in the northern<br />
dairy belt are boosting supply in order<br />
to maintain income levels. However,<br />
new product entering intervention stores<br />
has almost come to a halt for both butter<br />
and SMP. The public butter stocks are<br />
equivalent to just 4% of annual EU butter<br />
production; but the SMP stockpile<br />
is more burdensome as it represents<br />
about 30% of annual EU SMP production.<br />
There is still no clear policy solution for<br />
eliminating the stockpile.<br />
US milk production has finally begun<br />
to fall slightly below last year, despite<br />
negative farm profitability for many<br />
months and is expected to fall further over<br />
the rest of the year. Encouragingly, sales<br />
of surplus milk powder to the government<br />
have slowed in recent months – with the<br />
stockpile at 25% of annual production –<br />
and no such sales are forecast for 2010.<br />
Argentina’s milk production is reportedly<br />
up 3-4% to August in <strong>2009</strong>. However,<br />
a slowing trend of recent months<br />
is expected to continue, with full year<br />
forecasts of 1% growth. Brazil’s milk<br />
production has continued to trail previous<br />
year levels all through <strong>2009</strong>; with<br />
production down 4-5% to July. A milder<br />
recession, coupled with a quick recovery,<br />
across the region will continue to keep<br />
food demand strong and the domestic<br />
market as the primary focus. Exports have<br />
been very limited due domestic prices<br />
being more attractive, but any continued<br />
improvement in international markets will<br />
trigger an increase in exports.<br />
The New Zealand production season has<br />
started slowly (down 2% in first three<br />
months) as producers have rationalised<br />
feed and fertiliser costs, lowered stocking<br />
rates and adjusted to a lower milk price<br />
environment. Nevertheless, farmers are<br />
expected to make-up any lost ground once<br />
the season gets into full swing.<br />
<strong>Dairy</strong> Australia’s forecast for <strong>2009</strong>/10 milk<br />
production in Australia is 9.0 billion litres<br />
– 4% down on production last year. This<br />
reflects the impact of farmer exits from<br />
northern Victoria / southern Riverina,<br />
very wet winter and spring conditions<br />
in Tasmania and the reported reductions<br />
in cow numbers and supplementary<br />
feeding rates across the industry.<br />
8<br />
<strong>Australian</strong> <strong>Dairy</strong> <strong><strong>In</strong>dustry</strong> <strong>In</strong> <strong>Focus</strong> <strong>2009</strong>
The <strong>Australian</strong> dairy industry<br />
An important rural industry<br />
The dairy industry continues to be one<br />
of Australia’s major rural industries.<br />
Based on a farmgate value of production<br />
of $4.0 billion in 2008/09, it ranks third<br />
behind the beef and wheat industries.<br />
It is estimated that approximately 40,000<br />
people are directly employed on dairy<br />
farms and manufacturing plants. Related<br />
transport and distribution activities,<br />
and research and development projects,<br />
represent further employment associated<br />
with the industry.<br />
<strong>Dairy</strong> is also one of Australia’s leading<br />
rural industries in terms of adding value<br />
through further downstream processing.<br />
Much of this processing occurs close<br />
to farming areas, thereby generating<br />
significant economic activity and<br />
employment in country regions. ABARE<br />
estimates this regional economic multiplier<br />
effect to be in the order of 2.5 from<br />
the dairy industry.<br />
<strong>Dairy</strong>ing is a well-established industry<br />
across temperate and some subtropical<br />
areas of Australia. While the bulk of<br />
milk production occurs in south-east<br />
corner of the country – some 80% in the<br />
three states of Victoria, South Australia<br />
and Tasmania – all states have dairy<br />
industries that supply fresh drinking<br />
milk to nearby cities and towns. A range<br />
of high-quality consumer products,<br />
including fresh milks, custards, yogurts<br />
and a wide variety of cheese types, are<br />
produced in most <strong>Australian</strong> states.<br />
Nevertheless, the manufacturing of longer<br />
shelf life products, such as cheese and<br />
specialised milk powders, is steadily<br />
becoming more concentrated in the southeast<br />
region of Australia.<br />
Strong growth characterised the dairy<br />
industry through the 1990s, but that<br />
growth has stalled in the past decade. The<br />
industry experienced a slow recovery from<br />
the severe widespread drought of 2002/03,<br />
only to have ongoing dry conditions. The<br />
resulting low water storage levels have<br />
significantly limited water allocations<br />
in irrigated dairying regions.<br />
Table 2 details the long-term trends<br />
in a number of key industry measures.<br />
Figure 7 provides a comparison across<br />
the five major agricultural industries<br />
in Australia – comparing farmgate and<br />
export sales values – and shows the<br />
relative importance of the dairy industry<br />
within the agricultural sector.<br />
Table 2<br />
<strong>Australian</strong> dairy industry – long term trends<br />
CAGR<br />
CAGR CAGR since<br />
At June 30 1980 1990 1980s 2000 1990s <strong>2009</strong> (p) 1990<br />
Milk production (million Litres) 5,432 6,262 1.4% 10,847 5.6% 9,388 2.2%<br />
<strong>Dairy</strong> cows (’000) 1,880 1,654 –1.3% 2,171 2.8% 1,600 –0.2%<br />
Farm numbers 21,994 15,396 –3.5% 12,896 –1.8% 7,924 –3.4%<br />
Value of farm production* ($m) $3,114 $2,903 –0.7% $3,676 2.4% $3,981 1.7%<br />
Value of ex-factory production* ($m) $7,976 $7,169 –1.1% $11,047 4.4% $11,960 2.7%<br />
Estimated value-added* ($m) $1,942 $2,142 1.0% $2,477 1.5% $2,035 –0.3%<br />
Per capita consumption (milk equiv) 239 244 0.2% 274 1.2% 301 1.1%<br />
Export value* ($m) $940 $525 –5.7% $3,352 20.4% $2,922 9.5%<br />
Export share of production 22% 31% 54% 45%<br />
Sources: ABS, ADC, DA, State Authorities<br />
*Expressed in 2008/09 dollars.<br />
<strong>Australian</strong> <strong>Dairy</strong> <strong><strong>In</strong>dustry</strong> <strong>In</strong> <strong>Focus</strong> <strong>2009</strong> 9
Figure 7<br />
Farmgate value vs export sales value – 2007/08<br />
Farm<br />
$10,000<br />
Exports<br />
$8,000<br />
$ million<br />
$6,000<br />
$4,000<br />
$2,000<br />
A world-competitive industry<br />
<strong>Australian</strong> dairy farmers operate<br />
in a deregulated and open market; the<br />
only government involvement being in the<br />
administration of food standards and food<br />
safety assurance systems. Consequently,<br />
international markets and prices are<br />
the major factor determining the price<br />
received by farmers for their milk.<br />
At an average of approximately US$35 per<br />
100kg of milk last year, <strong>Australian</strong> dairy<br />
farmers generally receive a comparatively<br />
lower price compared to many major<br />
producing countries and so must operate<br />
highly cost-efficient production systems.<br />
This is regularly borne out by international<br />
comparisons, where <strong>Australian</strong> farms<br />
consistently have costs of production<br />
in the lower cost category of all farms<br />
$0<br />
Wheat Red meat <strong>Dairy</strong> Wool Sugar<br />
Source: ABS<br />
in such surveys. The fact that around half<br />
of Australia’s milk production has been<br />
exported over the past decade reflects this<br />
high level of competitiveness.<br />
However, this has become increasingly<br />
more difficult in recent years. Farm cost<br />
structures have increased in response to the<br />
need to adapt to drier conditions where<br />
rain fed pastures are regularly contributing<br />
a lower proportion of the total feed base<br />
available to the herd.<br />
As shown in Figure 8, the convergence<br />
of prices received by farmers around the<br />
world during the commodity price boom<br />
in 2007 – where <strong>Australian</strong> and New<br />
Zealand farmgate milk prices increased<br />
strongly in response to strong world prices<br />
– has begun to dissipate and the spread<br />
widened again in the past year.<br />
Figure 8<br />
<strong>In</strong>ternational farmgate milk prices (US$/100kg)<br />
70<br />
60<br />
Canada<br />
50<br />
$US/100kg<br />
40<br />
30<br />
20<br />
10<br />
0<br />
US<br />
NZ<br />
Australia<br />
EU 15<br />
EU 10<br />
Source: <strong>Dairy</strong> Australia<br />
1995<br />
1996<br />
1997<br />
1998<br />
1999<br />
2000<br />
2001<br />
2002<br />
2003<br />
2004<br />
2005<br />
2006<br />
2007<br />
2008<br />
10<br />
<strong>Australian</strong> <strong>Dairy</strong> <strong><strong>In</strong>dustry</strong> <strong>In</strong> <strong>Focus</strong> <strong>2009</strong>
Farm facts<br />
Australia’s climate and natural resources<br />
are generally favourable to dairying and<br />
allow the industry to be predominantly<br />
pasture-based, with approximately 75%<br />
of cattle feed requirements coming from<br />
grazing years with ‘traditional’ seasonal<br />
conditions. This results in efficient, lowcost,<br />
high-quality milk production.<br />
Most dairy production regions are located<br />
in coastal areas, where pasture growth<br />
generally depends on natural rainfall.<br />
Nevertheless, the inland irrigation schemes<br />
in northern Victoria and southern NSW<br />
are significant, accounting for around<br />
a quarter of national milk production.<br />
Feedlot-based dairying remains the<br />
exception in Australia, although the<br />
use of supplementary feed – grains,<br />
hay and silage – is widespread and has<br />
increased significantly in recent seasons<br />
as farmers have had to adapt to drier<br />
conditions in many dairying regions.<br />
According to the <strong>2009</strong> National <strong>Dairy</strong><br />
Farmer Survey, some 93% of dairy farms<br />
fed an average of 1.5 tonnes of grain,<br />
grain mixes or feed concentrates per<br />
cow during the 2008/09 season, up from<br />
an average of 1.4 tonnes in 2006/07. While<br />
the increase was most marked in the most<br />
drought-affected regions, feeding rates<br />
have risen in the majority of dairying<br />
regions around Australia.<br />
Owner-operated farms dominate the<br />
<strong>Australian</strong> dairy industry. Corporate<br />
farms make up just 2% of the total, with<br />
share farmers involved in 18% of local<br />
farms in 2007/08.<br />
The number of dairy farms has halved<br />
over the past two decades – to 7,920 in <strong>2009</strong><br />
– although the strong milk prices of the<br />
past two years greatly reduced the rate<br />
of attrition overall and even led to an<br />
increase in registered dairy farms<br />
in Victoria for two consecutive years.<br />
Nevertheless, falling farm numbers reflect<br />
a long-term trend observed in agriculture<br />
around the world, as reduced price support<br />
and changing business practices have<br />
encouraged a shift to larger, more efficient<br />
operating systems.<br />
Table 3<br />
Number of registered dairy farms<br />
NSW VIC QLD SA WA TAS AUST<br />
1979/80 3,601 11,467 3,052 1,730 622 1,522 21,994<br />
1989/90 2,220 8,840 1,970 969 496 901 15,396<br />
1999/00 1,725 7,806 1,545 667 419 734 12,896<br />
2000/01 1,391 7,559 1,305 587 359 638 11,839<br />
2001/02 1,323 7,079 1,152 538 344 612 11,048<br />
2002/03 1,290 6,801 1,125 516 325 597 10,654<br />
2003/04 1,096 6,242 967 458 305* 543 9,611<br />
2004/05 1,063 6,108 885 402 278 507 9,243<br />
2005/06 1,024 5,892 802 383 245 498 8,844<br />
2006/07 924 5,346 734 354 222 475 8,055<br />
2007/08 886 5,422 664 332 186 463 7,953<br />
2008/09 (p) 860 5,462 648 320 183 451 7,924<br />
Source: State Milk Authorities<br />
* Estimate<br />
<strong>Australian</strong> <strong>Dairy</strong> <strong><strong>In</strong>dustry</strong> <strong>In</strong> <strong>Focus</strong> <strong>2009</strong> 11
The trends in farm numbers have<br />
meant that the average herd size has<br />
increased from 85 cows in 1980 to over<br />
200 in 2008/09.<br />
Analysis of the 2008 National <strong>Dairy</strong><br />
Farmer Survey indicated that 8% of dairy<br />
farms had herd sizes of more than 500<br />
cows and produced 25% of the total<br />
milk produced in Australia. At the other<br />
end of the spectrum, 48% of farms had<br />
fewer than 200 cows and produced<br />
24% of the milk.<br />
The dominant dairy breed in Australia<br />
is the Holstein Friesian, accounting for<br />
approximately 67% of all dairy cattle,<br />
followed by the Jersey at more than 10%<br />
and then the Holstein/Jersey cross. More<br />
than 85% of dairy farmers use artificial<br />
insemination and access some of the best<br />
genetic material in the world.<br />
The genetic evaluation of dairy cattle<br />
is conducted by the <strong>Australian</strong> <strong>Dairy</strong><br />
Herd Improvement Service (ADHIS),<br />
using one of the most sophisticated<br />
evaluation systems available.<br />
Improvements in herd genetics, pasture<br />
management practices and supplementary<br />
feeding regimes have seen the average<br />
yield per cow increase from 2,850 litres<br />
a year to around 5,750 litres over the past<br />
three decades. Combining this increase<br />
in yield per cow with the increase<br />
in average herd size, the average annual<br />
milk production per farm has increased<br />
from 247,000 litres to 1,185,000 litres over<br />
the same period.<br />
Unlike many countries around the world,<br />
there is no legislative control over the<br />
price milk processing companies pay<br />
farmers for their milk. Farmgate prices<br />
vary between manufacturers, with<br />
individual company returns being affected<br />
Table 4<br />
Number of dairy cows (000 head)<br />
NSW VIC QLD * SA WA TAS AUST<br />
At March 31<br />
1979/80 311 1,047 247 103 71 103 1,880<br />
1989/90 238 968 201 89 64 92 1,654<br />
1999/00 289 1,377 195 105 65 139 2,171<br />
At June 30<br />
2000/01** 268 1,377 186 124 72 148 2,176<br />
2001/02 264 1,363 174 110 75 134 2,123<br />
2002/03 250 1,303 159 117 77 142 2,050<br />
2003/04 248 1,297 171 116 74 133 2,038<br />
2004/05 (e) 245 1,295 150 115 70 135 2,010<br />
12<br />
New Series***<br />
2005/06 222 1,217 127 104 67 143 1,880<br />
2006/07 213 1,157 122 105 54 133 1,786<br />
2007/08 (r) 195 1,055 100 103 54 134 1,641<br />
2008/09 (e) 185 1,020 110 100 53 132 1,600<br />
* <strong>For</strong> 1999 and 2000, Qld state figure includes Northern Territory cow numbers.<br />
** From 2001 census date is June 30, NT and ACT numbers are included in national total<br />
*** Change in ABS data collection<br />
Source: ABS and <strong>Dairy</strong> Australia<br />
<strong>Australian</strong> <strong>Dairy</strong> <strong><strong>In</strong>dustry</strong> <strong>In</strong> <strong>Focus</strong> <strong>2009</strong>
y factors such as product and market<br />
mix, marketing strategies and processing<br />
efficiencies. The majority of milk prices<br />
are based on both the milkfat and protein<br />
content of the milk. Payments from<br />
processors to individual farmers can<br />
also vary marginally, as firms operate<br />
a range of incentive/penalty payments<br />
related to milk quality, productivity and<br />
off-peak supplies. There are also volume<br />
incentives in place to encourage milk<br />
supply to particular processing plants<br />
to improve operating efficiencies.<br />
The price farmers receive also varies<br />
across states, reflecting how milk is used<br />
in the marketplace. <strong>For</strong> example, many<br />
farmers in the southern regions receive<br />
a ‘blended’ price, incorporating returns<br />
from both drinking and manufacturing<br />
milk. However, higher prices are often<br />
received for year-round supply of milk<br />
under commercial contract arrangements<br />
in the northern dairy regions, where fresh<br />
drinking milk makes up a much larger<br />
proportion of the production mix.<br />
Farmgate prices reached record highs<br />
in 2007/08 and, despite falling 15%<br />
during 2008/09, remained well above<br />
those of previous seasons. However,<br />
the collapse in world dairy commodity<br />
prices during 2008 saw the almost<br />
unprecedented event of a step-down<br />
in farmgate milk prices during the season<br />
for the 75% of <strong>Australian</strong> dairy farmers<br />
who supply exporting companies. This last<br />
happened in 1973.<br />
Apart from the many factors affecting<br />
the milk prices received by individual<br />
farmers, as outlined in the preceding<br />
paragraphs, the value of the <strong>Australian</strong><br />
dollar in foreign exchange markets against<br />
the US dollar and the Euro is also critical<br />
in determining company returns. <strong>In</strong> the<br />
past decade, the <strong>Australian</strong> dollar has<br />
ranged in value against the US dollar from<br />
US$ 0.52 to more than US$0.90.<br />
The impact of currency changes on local<br />
returns is clearly shown in Figure 9. The<br />
<strong>Australian</strong> Export <strong>In</strong>dex represents the<br />
weighted average value of a ‘basket’<br />
of Australia’s major dairy exports<br />
compared to a baseline set at January 2000.<br />
Table 5<br />
Average annual milk production per cow<br />
NSW VIC QLD SA WA TAS AUST<br />
1979/80 2,870 3,012 1,984 3,163 3,105 2,958 2,848<br />
1989/90 3,602 3,920 3,122 3,934 4,205 3,791 3,781<br />
1999/00 4,827 4,989 4,349 6,790 6,338 4,381 4,996<br />
2000/01 4,687 4,977 3,943 6,369 5,903 4,177 4,859<br />
2001/02 5,030 5,391 4,067 5,933 5,402 4,646 5,215<br />
2002/03 4,996 4,885 4,230 6,556 5,348 4,304 4,913<br />
2003/04 5,093 4,944 4,162 6,021 5,285 4,219 4,925<br />
2004/05 4,925 5,101 3,735 5,862 5,418 4,497 4,983<br />
2005/06 5,039 5,221 4,076 5,791 5,369 4,581 5,108<br />
2006/07 5,151 5,261 4,033 6,417 5,235 4,696 5,182<br />
2007/08 (r) 5,031 5,393 4,163 5,799 5,907 4,961 5,275<br />
2008/09 (e) 5,532 5,864 4,995 6,142 6,326 5,303 5,750<br />
Source: <strong>Dairy</strong> manufacturers, ABS and <strong>Dairy</strong> Australia<br />
<strong>Australian</strong> <strong>Dairy</strong> <strong><strong>In</strong>dustry</strong> <strong>In</strong> <strong>Focus</strong> <strong>2009</strong> 13
The products included in the <strong>In</strong>dex are<br />
butter, cheese, skim milk powder and<br />
wholemilk powder, and they are weighted<br />
by their contribution to Australia’s dairy<br />
export volumes. The <strong>In</strong>dex takes into<br />
consideration individual dairy product<br />
export price fluctuations and movements<br />
in the <strong>Australian</strong>/US dollar exchange rate.<br />
The <strong>In</strong>dex shows that early in the decade<br />
<strong>Australian</strong> industry returns benefited<br />
from a low dollar. However, export returns<br />
were relatively weaker in <strong>Australian</strong><br />
dollar terms during 2007/08, where the<br />
<strong>Australian</strong> dollar was ‘stronger’ compared<br />
to the US dollar and averaged US$0.90<br />
over the season. More recently, a firming<br />
Table 6<br />
Typical factory paid prices<br />
2002/03 2003/04 2004/05 2005/06 2006/07 2007/08 2008/09 (p)<br />
NSW cents/litre 32.8 30.9 32.9 34.3 35.7 48.6 52.4<br />
$/kg milk solids 4.64 4.29 4.62 4.80 5.02 6.73 7.29<br />
VIC cents/litre 24.8 26.7 31.5 32.9 32.0 50.0 39.1<br />
$/kg milk solids 3.35 3.57 4.23 4.44 4.32 6.68 5.14<br />
QLD cents/litre 34.8 33.8 35.0 36.6 38.8 51.8 57.2<br />
$/kg milk solids 4.94 4.72 4.84 4.99 5.38 7.14 7.89<br />
SA cents/litre 30.3 28.2 30.1 32.0 32.6 48.6 44.6<br />
$/kg milk solids 4.22 3.90 4.19 4.49 4.57 6.75 6.19<br />
WA cents/litre 28.2 27.4 27.2 29.0 32.0 41.3 49.2<br />
$/kg milk solids 4.04 3.91 3.89 4.09 4.49 5.79 6.79<br />
TAS cents/litre 25.9 27.2 30.9 33.6 36.5 50.2 41.3<br />
$/kg milk solids 3.43 3.54 4.05 4.39 4.79 6.63 5.40<br />
AUST cents/litre 27.1 27.9 31.5 33.1 33.2 49.6 42.4<br />
$/kg milk solids 3.71 3.76 4.28 4.50 4.51 6.69 5.65<br />
Source: <strong>Dairy</strong> manufacturers<br />
Figure 9<br />
<strong>Australian</strong> Export <strong>In</strong>dex<br />
350<br />
Jan 2000 = 100<br />
300<br />
$US terms<br />
250<br />
200<br />
150<br />
$A terms<br />
100<br />
50<br />
0<br />
Jan 00<br />
Jul 00<br />
Jan 01<br />
Jul 01<br />
Jan 02<br />
Jul 02<br />
Jan 03<br />
Jul 03<br />
Jan 04<br />
Jul 04<br />
Jan 05<br />
Jul 05<br />
Jan 06<br />
Jul 06<br />
Jan 07<br />
Jul 07<br />
Jan 08<br />
Jul 08<br />
Jan 09<br />
Jul 09<br />
14<br />
<strong>Australian</strong> <strong>Dairy</strong> <strong><strong>In</strong>dustry</strong> <strong>In</strong> <strong>Focus</strong> <strong>2009</strong><br />
Source: <strong>Dairy</strong> Australia and ABS
<strong>Australian</strong> dollar has lowered local<br />
currency returns from export markets.<br />
The long-term downward trend<br />
in inflation-adjusted farmgate prices<br />
(Figure 10) is in line with returns from<br />
other agricultural industries over the past<br />
two decades. Despite the occasional peaks<br />
– in 1992/93, 2001/02 and 2007/08 – the<br />
line has traditionally returned to trend<br />
and clearly illustrates the imperative<br />
to continually improve productivity<br />
throughout the industry.<br />
The annual ABARE Farm Survey estimates<br />
the financial performance of <strong>Australian</strong><br />
dairy farms. The two main measures<br />
are farm cash income (defined as total<br />
cash receipts less total cash costs) and<br />
farm business profit (which takes into<br />
account the build up in trading stocks,<br />
less depreciation and the value of farm<br />
labour). Trends in farm cash income and<br />
farm business profit have shown increased<br />
variability over the past decade. Figure<br />
11 illustrates how they were strong in the<br />
year of record high milk production<br />
volumes in 2001/02 – encouraged<br />
by a combination of favourable climatic<br />
and market conditions – fell due to the<br />
dramatic impact of the drought in the<br />
2002/03 season; slowly recovered and<br />
consolidated over the following three<br />
years, before another financially crippling<br />
drought in 2006/07. Significant financial<br />
recovery occurred in 2007/08 driven<br />
by high farmgate milk prices only to be<br />
reversed again in 2008/09 by sharply<br />
higher input costs at a time of falling<br />
milk prices.<br />
ABARE estimates that the average farm<br />
cash income was $74,000 in 2008/09 – with<br />
a range between regions from $31,900<br />
in the northern Victoria/Riverina region<br />
up to $151,300 in Western Australia.<br />
The national average farm business loss<br />
was estimated at $6,000 last year. However,<br />
figures ranged from a loss of $43,900 to a<br />
profit of $57,200 in the same regions.<br />
Figure 10<br />
Factory paid prices (cents/litre)<br />
60<br />
50<br />
Average prices adjusted for inflation<br />
using index of farmer prices paid (ABARE)<br />
40<br />
Market milk price<br />
30<br />
Cents/litre<br />
20<br />
Manufacturing milk price<br />
Weighted average of milk prices<br />
to 30 June 2000<br />
10<br />
0<br />
Deregulation<br />
1989/90<br />
1990/91<br />
1991/92<br />
1992/93<br />
1993/94<br />
1994/95<br />
1995/96<br />
1996/97<br />
1997/98<br />
1998/99<br />
1999/00<br />
2000/01<br />
2001/02<br />
2002/03<br />
2003/04<br />
2004/05<br />
2005/06<br />
2006/07<br />
2007/08<br />
2008/09(p)<br />
Source: <strong>Dairy</strong> manufacturers and ABARE<br />
<strong>Australian</strong> <strong>Dairy</strong> <strong><strong>In</strong>dustry</strong> <strong>In</strong> <strong>Focus</strong> <strong>2009</strong> 15
Figure 11<br />
<strong>Australian</strong> dairy farm financial performance<br />
$150,000<br />
$125,000<br />
$100,000<br />
$75,000<br />
$50,000<br />
$25,000<br />
$0<br />
($25,000)<br />
($50,000)<br />
($75,000)<br />
($100,000)<br />
Farm business profit<br />
Farm cash income<br />
1990/91<br />
1991/92<br />
1992/93<br />
1993/94<br />
1994/95<br />
1995/96<br />
1996/97<br />
1997/98<br />
1998/99<br />
1999/00<br />
2000/01<br />
2001/02<br />
2002/03<br />
2003/04<br />
2004/05<br />
2005/06<br />
2006/07<br />
2007/08<br />
2008/09 (p)<br />
Source: ABARE<br />
The range of financial performance<br />
is very wide across dairying regions and<br />
there most likely are wide variations<br />
within regions.<br />
Despite the significant economic pressures<br />
on dairy farming operations in recent<br />
years and strongly increasing debt levels,<br />
it is interesting to note that the level<br />
of farm business equity, as estimated<br />
by ABARE, continues to be slightly above<br />
the long-term average of 80% as the<br />
capital value of farming land assets has<br />
also increased strongly.<br />
16<br />
<strong>Australian</strong> <strong>Dairy</strong> <strong><strong>In</strong>dustry</strong> <strong>In</strong> <strong>Focus</strong> <strong>2009</strong>
Milk production<br />
While farm numbers have steadily<br />
decreased over the past three decades,<br />
milk output generally increased, due<br />
to increasing cow numbers and improved<br />
cow yields up until the major drought<br />
of 2002/03. The following few years were<br />
a period of consolidation for the industry,<br />
with falling cow numbers and seasonal<br />
conditions constraining production. Recent<br />
seasons have seen continuing drought<br />
conditions across many dairying and grain<br />
growing regions, further reducing cow<br />
numbers and limiting any growth in milk<br />
production. Nevertheless, there have been<br />
significant on-farm adaptation strategies<br />
employed to manage the highly variable<br />
conditions of recent years, particularly<br />
in the inland irrigation regions of northern<br />
Victoria, and central and southern inland<br />
New South Wales where water allocations<br />
have been very low for a number of years.<br />
Figure 12<br />
<strong>Australian</strong> milk production vs indicies of farms and cows milked<br />
12,000<br />
Cows milked (index) Farm no. (index)<br />
10,000<br />
Milk production (million litres)<br />
Million litres<br />
8,000<br />
6,000<br />
4,000<br />
140<br />
120<br />
100<br />
80<br />
60<br />
40<br />
<strong>In</strong>dex<br />
0<br />
1986/87<br />
1987/88<br />
1988/89<br />
1990/91<br />
1991/92<br />
1992/93<br />
1993/94<br />
1994/95<br />
1995/96<br />
1996/97<br />
1997/98<br />
1989/90<br />
1998/99<br />
1999/00<br />
2000/01<br />
2001/02<br />
2002/03<br />
2003/04<br />
2004/05<br />
2005/06<br />
2006/07<br />
2007/08<br />
2008/09 (p)<br />
0<br />
2,000<br />
20<br />
Source: <strong>Dairy</strong> manufacturers, ABS, State Authorities and <strong>Dairy</strong> Australia<br />
Figure 13<br />
Seasonality of milk production in Australia, 2008/09 (million litres)<br />
1,200<br />
1,000<br />
800<br />
600<br />
400<br />
200<br />
0<br />
Jul<br />
Aug<br />
Sep<br />
Oct<br />
Nov<br />
Dec<br />
Jan<br />
Feb<br />
Mar<br />
Apr<br />
May<br />
Jun<br />
Source: <strong>Dairy</strong> manufacturers<br />
<strong>Australian</strong> <strong>Dairy</strong> <strong><strong>In</strong>dustry</strong> <strong>In</strong> <strong>Focus</strong> <strong>2009</strong> 17
The underlying trend has continued<br />
to fewer farms, larger herds and increasing<br />
levels of milk production per farm.<br />
Farmers have made many changes to their<br />
general farm management practices and<br />
adopted a range of improved technologies,<br />
including soil testing, fodder conservation,<br />
supplementary feeding, improved animal<br />
genetics, artificial insemination programs,<br />
the use of new milking equipment and<br />
techniques, and the widespread use<br />
of computers to record and monitor<br />
herd and individual cow performance.<br />
Milk production is concentrated in the<br />
south-east corner of Australia, with<br />
Victoria, Tasmania and South Australia<br />
accounting for 80% of the national output.<br />
<strong>Australian</strong> milk production remains<br />
strongly seasonal in the key southeastern<br />
dairying regions, reflecting the<br />
pasture-based nature of the industry. Milk<br />
production peaks in October and tapers<br />
off in the cooler months from April. The<br />
production of long shelf-life manufactured<br />
products in these parts of the country<br />
has enabled maximum milk utilisation<br />
within the seasonal cycle. However, the<br />
seasonality of milk output in Queensland,<br />
New South Wales and Western<br />
Australia is much less pronounced, due<br />
to a greater focus on drinking milk and<br />
fresh products in these states. Farmers<br />
in these states manage calving and<br />
feed systems to ensure more even yearround<br />
production.<br />
See Appendix 2 for more details on the<br />
seasonality of milk production by state.<br />
<strong>Australian</strong> milk production increased<br />
by 165 million litres, or 1.8%, to 9,338<br />
million litres in 2008/09. This reflected<br />
generally benign conditions around most<br />
of the country during the season; with<br />
most regions showing growth over the<br />
previous year. However, the irrigated<br />
regions of southern New South Wales<br />
and northern Victoria faced very difficult<br />
conditions, with yet another season of very<br />
low water allocations and milk production<br />
suffered accordingly.<br />
Table 7<br />
Milk production (million litres)<br />
NSW VIC QLD SA WA TAS AUST<br />
1979/80 907 3,151 508 329 222 315 5,432<br />
1989/90 879 3,787 629 356 267 344 6,262<br />
1999/00 1,395 6,870 848 713 412 609 10,847<br />
2000/01 1,326 6,784 760 699 388 590 10,546<br />
2001/02 1,343 7,405 744 715 393 671 11,271<br />
2002/03 1,302 6,584 720 733 404 585 10,328<br />
2003/04 1,271 6,434 674 703 404 590 10,076<br />
2004/05 1,218 6,613 619 679 398 600 10,127<br />
18<br />
New series*<br />
2005/06 1,197 6,651 597 646 377 622 10,089<br />
2006/07 1,105 6,297 534 655 350 642 9,583<br />
2007/08 1,049 6,102 485 606 319 662 9,223<br />
2008/09 (p) 1,065 6,135 512 628 340 708 9,388<br />
* From July 2005, data collection based on farm location<br />
Source: <strong>Dairy</strong> manufacturers<br />
<strong>Australian</strong> <strong>Dairy</strong> <strong><strong>In</strong>dustry</strong> <strong>In</strong> <strong>Focus</strong> <strong>2009</strong>
Cows’ milk consists of solids (milkfat,<br />
protein, lactose and minerals) in water,<br />
with water making up about 87%<br />
of the volume. The milkfat and protein<br />
components are those on which companies<br />
base their farmgate milk prices. Milk<br />
composition varies between regions<br />
due to a number of factors, such as cow<br />
breed and age, nutrition and feed quality,<br />
as shown in Table 8.<br />
The previous long-term trend of expanding<br />
total milk output, an increasing proportion<br />
of milk used for manufacturing dairy<br />
products and hence a declining drinking<br />
milk share of production have been<br />
reversed over the past seven years,<br />
as shown in Figure 14.<br />
The volumes of milk going into the<br />
drinking milk sector have shown steady<br />
growth recently and last year accounted<br />
for 24% of total milk production – up from<br />
a figure of 17% in 2001/02.<br />
The differential in the proportion<br />
of drinking milk to manufacturing<br />
milk by state is shown in Figure 15.<br />
It graphically illustrates the greater<br />
focus on drinking milk in the product<br />
mix in Queensland, New South Wales<br />
and Western Australia.<br />
Table 8<br />
Average protein/fat composition by state (%)<br />
NSW VIC QLD SA WA TAS AUST<br />
Milkfat<br />
2002/03 3.87 4.12 3.93 3.94 3.98 4.26 4.06<br />
2003/04 3.94 4.16 3.95 3.96 3.98 4.32 4.10<br />
2004/05 3.89 4.12 3.99 3.94 3.87 4.28 4.07<br />
2005/06 3.91 4.08 4.00 3.88 3.91 4.29 4.05<br />
2006/07 3.88 4.09 3.98 3.90 3.93 4.25 4.05<br />
2007/08 3.97 4.14 4.01 3.95 3.95 4.20 4.10<br />
2008/09 (p) 3.93 4.22 3.97 3.93 3.99 4.25 4.15<br />
Protein<br />
2002/03 3.21 3.27 3.13 3.24 3.11 3.29 3.24<br />
2003/04 3.26 3.34 3.21 3.27 3.15 3.36 3.31<br />
2004/05 3.23 3.32 3.23 3.24 3.11 3.35 3.29<br />
2005/06 3.25 3.33 3.33 3.25 3.16 3.37 3.31<br />
2006/07 3.24 3.33 3.22 3.25 3.20 3.37 3.30<br />
2007/08 3.25 3.34 3.25 3.25 3.19 3.39 3.32<br />
2008/09 (p) 3.26 3.38 3.28 3.28 3.26 3.39 3.35<br />
Source: <strong>Dairy</strong> manufacturers<br />
<strong>Australian</strong> <strong>Dairy</strong> <strong><strong>In</strong>dustry</strong> <strong>In</strong> <strong>Focus</strong> <strong>2009</strong> 19
Figure 14<br />
Drinking and manufacturing milk production (million litres)<br />
Milk for<br />
manufacturing<br />
Drinking milk<br />
12,000<br />
10,000<br />
8,000<br />
Million litres<br />
6,000<br />
4,000<br />
2,000<br />
0<br />
1995/96<br />
1996/97<br />
1997/98<br />
1998/99<br />
1999/00<br />
2000/01<br />
2001/02<br />
2002/03<br />
2003/04<br />
2004/05<br />
2005/06<br />
2006/07<br />
2007/08<br />
2008/09(p)<br />
Source: <strong>Dairy</strong> manufacturers<br />
Figure 15<br />
Milk Production – shares by state, 2008/09<br />
Drinking milk<br />
Milk for<br />
manufacturing<br />
NSW<br />
VIC<br />
QLD<br />
SA<br />
WA<br />
TAS<br />
AUST<br />
0% 10% 20% 30% 40% 50% 60% 70% 80% 90% 100%<br />
Source: <strong>Dairy</strong> manufacturers<br />
20<br />
<strong>Australian</strong> <strong>Dairy</strong> <strong><strong>In</strong>dustry</strong> <strong>In</strong> <strong>Focus</strong> <strong>2009</strong>
<strong>Dairy</strong> manufacturing<br />
As in the farm sector, the milk processing<br />
sector is undergoing continuing<br />
rationalisation. This has resulted<br />
in improved factory capacity, as larger<br />
operations have improved their efficiency<br />
and economies of scale. The lack of growth<br />
in milk production over the past six years<br />
has relieved the pressure on <strong>Australian</strong><br />
dairy companies to continue to invest<br />
in increasing processing capacity – at least<br />
in the short to medium term. <strong>In</strong>stead, the<br />
challenge has been to remove surplus<br />
capacity and to utilise the existing<br />
capacity as profitably as possible.<br />
The <strong>Australian</strong> dairy manufacturing sector<br />
is quite diverse and includes farmerowned<br />
co-operatives, public, private and<br />
multi-national companies.<br />
Co-operatives no longer dominate<br />
the industry and now account for<br />
approximately 40% of Australia’s milk<br />
production. The largest is Murray<br />
Goulburn, accounting for some 35%<br />
of national milk output. Smaller regional<br />
co-operatives include Challenge Dairies,<br />
Norco and Hastings Valley.<br />
Other <strong>Australian</strong> dairy companies cover<br />
a diverse range of markets and products,<br />
from the publicly listed Warrnambool<br />
Cheese and Butter Factory to the privately<br />
owned Bega Cheese Limited, Tatura Milk<br />
<strong>In</strong>dustries, Regal Cream and Burra Foods,<br />
to name a few, together with many highly<br />
specialised cheese manufacturers.<br />
Major multi-national dairy companies have<br />
operated in the <strong>Australian</strong> dairy industry<br />
for many years and currently include<br />
Fonterra, Kirin and Parmalat.<br />
The major rationalisation event during<br />
2008/09 was National Foods’ purchase<br />
of the <strong>Dairy</strong> Farmers Group in late-2008,<br />
which had significant implications for the<br />
domestic market. The ACCC – Australia’s<br />
national competition body – required<br />
divestiture of certain assets to ensure<br />
the state drinking milk markets remained<br />
competitive before giving approval for the<br />
takeover to proceed.<br />
The major manufactured product<br />
streams are:<br />
• drinking milk – fresh and UHT<br />
long-life;<br />
• skim milk powder (SMP)/<br />
buttermilk powder (BMP)/butter;<br />
• butter/casein;<br />
• cheese;<br />
• wholemilk powder (WMP);<br />
• other consumer products,<br />
such as yogurts, custards and<br />
dairy desserts; and<br />
• specialised ingredients, such as whey<br />
proteins, nutraceuticals, etc.<br />
Cheese is consistently the major product<br />
stream; utilising about one third<br />
of Australia’s milk production in 2008/09.<br />
This is slightly down on recent years.<br />
Skim milk powder/butter production<br />
was the next biggest user of milk; taking<br />
a quarter of all milk last year.<br />
Around 60% of manufactured product (in<br />
milk equivalent terms) is exported and the<br />
remaining 40% is sold on the <strong>Australian</strong><br />
market. This contrasts with drinking<br />
milk, where some 97% is consumed<br />
in the domestic market.<br />
See Appendix 3 for more details<br />
on the manufacturing processes.<br />
Figure 16<br />
The utilisation of <strong>Australian</strong> milk in 2008/09<br />
Cheese 33%<br />
Drinking milk 24%<br />
WMP 12%<br />
Casein/butter 4%<br />
SMP/butter 25%<br />
Other 2%<br />
Source: <strong>Dairy</strong> Australia<br />
<strong>Australian</strong> <strong>Dairy</strong> <strong><strong>In</strong>dustry</strong> <strong>In</strong> <strong>Focus</strong> <strong>2009</strong> 21
<strong>Dairy</strong> markets<br />
Over the past two decades <strong>Australian</strong><br />
milk production has been well above<br />
that volume required for domestic<br />
consumption, so that a significant<br />
proportion is destined for export markets.<br />
The share of total production exported<br />
has ranged from 40-60% over the period<br />
shown in Figure 17. <strong>In</strong> the past two years<br />
Australia exported around 45% of its<br />
milk production – the lowest proportion<br />
since the mid-1990s, due to the reduced<br />
availability of product for export.<br />
While Australia accounts for an estimated<br />
2% of the world’s milk production, it is<br />
a significant exporter of dairy products.<br />
Australia ranks fourth in terms of world<br />
dairy trade – with a 9% share – behind the<br />
European Union as a bloc, New Zealand<br />
and the US.<br />
Japan is the single most important export<br />
market for Australia, accounting for 19%<br />
of exports by value. <strong>Australian</strong> exports are<br />
concentrated in Asia, which represented<br />
71% of the total dairy export value<br />
of A$2.9 billion in 2008/09.<br />
This concentration of exports in Asia/East<br />
Asia reflects both Australia’s geographic<br />
proximity to these markets and the extent<br />
Figure 17<br />
<strong>Australian</strong> composition and exports (milk equivalents)<br />
Exports Share exported<br />
12,000<br />
Domestic<br />
10,000<br />
60%<br />
50%<br />
Million litres<br />
8,000<br />
6,000<br />
4,000<br />
2,000<br />
40%<br />
30%<br />
20%<br />
10%<br />
0<br />
1995/96<br />
1996/97<br />
1997/98<br />
1998/99<br />
1999/00<br />
2000/01<br />
2001/02<br />
2002/03<br />
2003/04<br />
2004/05<br />
2005/06<br />
2006/07<br />
2007/08<br />
2008/09(p)<br />
0%<br />
Source: <strong>Dairy</strong> manufacturers and ABS<br />
Table 9<br />
<strong>Australian</strong> dairy markets by product, 2008/09 (A$ million)<br />
Sth East Other Middle <strong>Australian</strong><br />
Asia Asia Europe East Africa Americas Other Total market (e)<br />
Butter/AMF 65 42 24 28 33 36 4 232 340<br />
Cheese 90 496 32 66 21 64 21 790 1,704<br />
Milk 29 28 0 0 1 0 13 71 3,128<br />
SMP 304 135 5 68 18 21 2 553 n/a<br />
WMP* 243 228 0 134 51 33 12 701 n/a<br />
Other** 158 243 16 16 6 53 83 575 2,029<br />
22<br />
Total 890 1172 77 312 130 207 135 2,922 7,201<br />
Source: <strong>Dairy</strong> Australia estimates and ABS<br />
*Also includes infant powder ** <strong>In</strong>cludes consumer products such as ice cream, custards, etc<br />
and mixtures but excludes industrial / ingredient usage.<br />
<strong>Australian</strong> <strong>Dairy</strong> <strong><strong>In</strong>dustry</strong> <strong>In</strong> <strong>Focus</strong> <strong>2009</strong>
to which Australia is excluded from other<br />
major markets by direct restrictions (as<br />
in the case of the European Union) or the<br />
impact of the export subsidy programs<br />
of major competitor countries.<br />
Asian markets have considerable potential<br />
for consumption growth as incomes rise<br />
and diets become more ‘westernised’.<br />
<strong>Australian</strong> dairy companies have proven<br />
track records in supplying these markets<br />
over a number of decades. The Middle<br />
East and the Americas are also becoming<br />
increasingly important markets for<br />
many <strong>Australian</strong> exporters.<br />
Australia’s top five export markets<br />
by volume in 2008/09 were Japan,<br />
Singapore, China, the Philippines and<br />
Malaysia; while the top five export markets<br />
by value were slightly different in Japan,<br />
China, Singapore, <strong>In</strong>donesia and Malaysia.<br />
The fastest growing export market for<br />
Australia has been China, which has lifted<br />
from fifth in both the above rankings<br />
in the past year.<br />
See Appendix 5 for detailed tables<br />
of Australia’s export markets.<br />
Figure 18<br />
Exporters’ share of world trade in 2008<br />
(milk equivalents)<br />
Australia 9%<br />
Other 14%<br />
Brazil 2%<br />
Ukraine 2%<br />
Argentina 4%<br />
US 10%<br />
New Zealand 28%<br />
EU 31%<br />
Source: <strong>Dairy</strong> Australia and ABS<br />
Figure 19<br />
<strong>Australian</strong> exports by region, 2008/09 (A$ million)<br />
South-East Asia $890m<br />
Japan $554m<br />
Other Asia $618m<br />
Europe $77m<br />
Middle East $312m<br />
Africa $130m<br />
Americas $207m<br />
Other $135m<br />
Source: ABS<br />
Table 10<br />
Top 10 <strong>Australian</strong> export destinations, 2008/09<br />
Volume – % of Value – % of<br />
Country Tonnes Total Country A$ million Total<br />
Japan 105,889 14% Japan 554 19%<br />
Singapore 80,196 10% China 240 8%<br />
China 61,269 8% Singapore 232 8%<br />
Philippines 50,125 7% <strong>In</strong>donesia 170 6%<br />
Malaysia 46,999 6% Malaysia 166 6%<br />
<strong>In</strong>donesia 46,321 6% Philippines 164 6%<br />
Thailand 32,079 4% United States 122 4%<br />
Hong Kong 29,444 4% Korea, South 113 4%<br />
New Zealand 28,800 4% Thailand 113 4%<br />
Korea, South 25,921 3% New Zealand 103 4%<br />
Source: <strong>Dairy</strong> Australia and ABS<br />
<strong>Australian</strong> <strong>Dairy</strong> <strong><strong>In</strong>dustry</strong> <strong>In</strong> <strong>Focus</strong> <strong>2009</strong> 23
<strong>Australian</strong> consumption<br />
of dairy products<br />
The major <strong>Australian</strong> consumer dairy<br />
products are drinking milk, cheese, butter<br />
and butter blends, and yogurt.<br />
Per capita consumption trends over<br />
the past two decades have varied<br />
quite significantly by individual<br />
product. These trends reflect changes<br />
in consumer tastes and preferences<br />
in response to a multitude of variables,<br />
such as multicultural influences on food<br />
trends, health perceptions about dairy<br />
products and manufacturers’ responses<br />
(with low-fat variants), new product<br />
development, flavour and packaging<br />
innovations, competitive category<br />
offerings, and the distribution and<br />
hence availability of products.<br />
Per capita consumption of drinking<br />
milk is currently estimated at 104 litres,<br />
unchanged from last year, after increasing<br />
steadily over the previous five years –<br />
thanks in no small part to the expansion<br />
of the ‘coffee culture’ in Australia.<br />
Cheese consumption has stabilised<br />
at between 12kg and 12.5kg in recent<br />
years, with an on-going shift from cheddar<br />
to non-cheddar varieties as consumer<br />
tastes have developed and diversified.<br />
Butter consumption slowed during<br />
the 1970s and 1980s, as people limited<br />
their intake of saturated fats. However,<br />
dairy blends with the perceived<br />
‘naturalness’ of butter products, have<br />
experienced growing popularity in the past<br />
two decades with per capita consumption<br />
of dairyspreads now around 4 kg per year.<br />
Yogurt is the ultimate ‘healthy snack’ for<br />
time-pressed consumers, combining both<br />
convenience and health attributes, but<br />
has shown a slight decline in per capita<br />
consumption in the past couple of years<br />
to just below 7kg per year.<br />
Table 11<br />
Per capita consumption of major dairy products (litres/kg)<br />
Milk Cheese Butter/Blends Yogurt<br />
(L) (kg) (kg) (kg)<br />
2004/05 100.2 11.3 4.1 6.6<br />
2005/06 100.5 11.7 3.9 7.0<br />
2006/07 103.0 12.0 3.8 7.1<br />
2007/08 (r) 103.7 12.5 4.1 6.9<br />
2008/09 (p) 103.7 12.3 4.0 6.7<br />
Source: <strong>Dairy</strong> manufacturers and <strong>Dairy</strong> Australia<br />
Figure 20<br />
Per capita consumption (litres/kg)<br />
24<br />
Other dairy products (kg)<br />
14<br />
12<br />
10<br />
8<br />
6<br />
4<br />
2<br />
0<br />
1986/87<br />
1987/88<br />
Milk<br />
1989/90<br />
1990/91<br />
1991/92<br />
1992/93<br />
1993/94<br />
1994/95<br />
1995/96<br />
1996/97<br />
1997/98<br />
1988/89<br />
<strong>Australian</strong> <strong>Dairy</strong> <strong><strong>In</strong>dustry</strong> <strong>In</strong> <strong>Focus</strong> <strong>2009</strong><br />
Cheese<br />
Yogurt<br />
1998/99<br />
1999/00<br />
2000/01<br />
2001/02<br />
2002/03<br />
2003/04<br />
2004/05<br />
2005/06<br />
2006/07<br />
2007/08<br />
2008/09(p)<br />
Butter/Blends<br />
120<br />
100<br />
80<br />
60<br />
40<br />
20<br />
0<br />
Drinking milk (litres)<br />
Source: <strong>Dairy</strong> manufacturers and <strong>Dairy</strong> Australia
Drinking milk<br />
Regular or wholemilk is standardised<br />
to a milkfat content of around 3.8%.<br />
Modified, reduced and low-fat milks<br />
are standardised to other specifications,<br />
with varying milkfat and solids nonfat<br />
levels. The cream removed during<br />
standardisation can be bottled as table<br />
cream or manufactured into butter<br />
or other dairy products.<br />
<strong>Australian</strong> milk consumption has been<br />
steadily shifting from regular to modified<br />
milk types, such as reduced and lowfat<br />
milks, over a number of years. This<br />
trend reversed for a period during 2008,<br />
as consumers responded to rapidly<br />
increasing retail prices by switching<br />
to the relatively lower-priced regular<br />
full cream milks. The longer term trend<br />
has returned during the most recent<br />
year. Sales of flavoured milks slowed<br />
Table 12<br />
Drinking milk sales by state (million litres)<br />
NSW ACT VIC QLD SA WA TAS AUST<br />
1979/80 531 437 249 127 119 41 1,504<br />
1989/90 582 449 316 150 164 47 1,730<br />
1999/00 597 440 383 185 190 48 1,933<br />
2000/01 633 456 393 201 201 50 1,934<br />
2001/02 626 460 403 185 200 50 1,924<br />
2002/03 620 475 404 183 208 52 1,942<br />
2003/04 627 476 418 196 212 52 1,981<br />
2004/05 641 486 429 200 215 53 2,024<br />
2005/06 (r) 660 499 444 192 216 50 2,061<br />
2006/07 (r) 692 510 474 201 226 53 2,156<br />
2007/08 (r) 682 524 499 205 237 55 2,202<br />
2008/09 (p) 696 533 510 208 241 56 2,244<br />
State figures exclude interstate traded milk prior to 2001, NSW includes ACT after June 2000.<br />
Source: Milk processors and State Milk Authorities<br />
Table 13<br />
Drinking milk sales by type (million litres)<br />
Regular Reduced Low Fat Flavoured UHT Total<br />
1989/90 1,257 322 111 40 1,730<br />
1999/00 1,099 498 173 164 1,933<br />
2000/01 (r) 1,094 415 95 165 165 1,934<br />
2001/02 (r) 1,074 435 105 170 140 1,924<br />
2002/03 (r) 1,055 440 120 174 153 1,942<br />
2003/04 (r) 1,057 462 118 190 154 1,981<br />
2004/05 (r) 1,063 492 116 199 154 2,024<br />
2005/06 (r) 1,093 488 124 201 155 2,061<br />
2006/07 (r) 1,107 530 125 213 181 2,156<br />
2007/08 (r) 1,126 553 123 213 187 2,202<br />
2008/09 (p) 1,143 572 118 210 201 2,244<br />
Source: Milk processors and State Milk Authorities<br />
<strong>Australian</strong> <strong>Dairy</strong> <strong><strong>In</strong>dustry</strong> <strong>In</strong> <strong>Focus</strong> <strong>2009</strong> 25
in 2008/09 as they tend to be an impulse<br />
purchase for many consumers – bought<br />
in the petrol and convenience retail sales<br />
channel – as economic uncertainty led<br />
consumers to watch their spending more<br />
closely than usual. On the other hand,<br />
UHT milk volumes grew strongly last year,<br />
aided by some significant supermarket<br />
promotional activity.<br />
There are now just two major players in the<br />
<strong>Australian</strong> drinking milk market: the<br />
enlarged National Foods after its takeover<br />
of the <strong>Dairy</strong> Farmers Group in late-2008<br />
(with the Pura and <strong>Dairy</strong> Farmers brands)<br />
and Parmalat (with the Pauls brand). There<br />
are also a number of smaller players in the<br />
marketplace with strong regional brands.<br />
The supermarket channel’s share<br />
of <strong>Australian</strong> drinking milk sales has<br />
continued to trend steadily up over recent<br />
years – to 50% in 2008/09. Supermarkets<br />
benefited generally from increased<br />
‘at home’ eating as consumers sought<br />
to economise over the past year.<br />
Private label brands account for 52% of total<br />
supermarket milk volumes, up from<br />
around 25% in 1999/2000. Their average<br />
price is significantly less than company<br />
branded products. This lower average price<br />
is due to a combination of product and<br />
pack size mix – with a greater proportion<br />
of private label purchases being bulk<br />
regular full cream milk.<br />
On the packaging front, plastic bottles<br />
now account for 80% of all milk sales<br />
in supermarkets, with the balance<br />
split evenly between gable-top cartons<br />
and UHT packs.<br />
There have also been significant<br />
movements within the pack sizes bought<br />
by consumers in supermarkets. While<br />
the 2-litre plastic bottle remains the most<br />
popular size, with nearly 40% share, this<br />
is down from close to 50% eight years ago.<br />
Similarly, the combined share of 1-litre<br />
cartons and plastic bottles has slipped<br />
from 33% to 20%. The major change has<br />
been in the explosive growth of the 3-litre<br />
plastic bottle, increasing its share of all<br />
supermarket milk sales from 13% to 35%<br />
since it first appeared in June 1998.<br />
<strong>In</strong> 2008/09, the average price of branded<br />
milk increased 5.7% to $2.20 per litre.<br />
When combined with a 1.8% increase<br />
in the average private label price to $1.24<br />
per litre, delivered an increase in the<br />
average supermarket price of 6 cents per<br />
litre to $1.71 per litre.<br />
Supermarket sales volumes grew<br />
by 3.3% in 2008/09; with the comparative<br />
sales performance between branded<br />
(+0.2%) and private label milks (+6.5%)<br />
varying markedly.<br />
Retail milk prices fell 11 cents per<br />
litre from late-February <strong>2009</strong> as the<br />
<strong>Dairy</strong> Adjustment Levy, used<br />
to fund the industry’s degregulation<br />
adjustment package, was removed from<br />
wholesales prices.<br />
See the section on <strong><strong>In</strong>dustry</strong> Levies on page 36<br />
for more details.<br />
Australia exports relatively small volumes<br />
of milk – predominantly as UHT product –<br />
with 80% of the total going into the Asian<br />
region and 13% into the island countries<br />
of the Pacific region.<br />
See Appendix 5 for more details<br />
of drinking milk exports.<br />
26<br />
<strong>Australian</strong> <strong>Dairy</strong> <strong><strong>In</strong>dustry</strong> <strong>In</strong> <strong>Focus</strong> <strong>2009</strong>
Cheese<br />
Australia produced 342,000 tonnes<br />
of cheese in 2008/09 – a 5% decrease<br />
on the previous year. While the production<br />
of cheddar, hard grating and mouldripened<br />
cheese types increased on the<br />
previous year – due in part to milk<br />
availability – the production of semi<br />
hard and fresh cheeses declined quite<br />
significantly as Australia’s key export<br />
markets contracted due to the global<br />
economic downturn.<br />
The longer-term trend away from<br />
cheddar cheeses towards non-cheddar<br />
cheese types has been apparent in both<br />
the production and consumption data<br />
for Australia for some years. However,<br />
2008/09 saw a reversal in this trend, with<br />
the non-cheddar share of total production<br />
dropping back from 52% to 48%.<br />
It is estimated that around 55% of the<br />
domestic sales of <strong>Australian</strong> cheese are<br />
through supermarkets. A significant<br />
proportion – mostly specialty cheeses –<br />
is sold through the smaller independent<br />
retail trade, with the remainder used<br />
in the foodservice sector and in food<br />
processing applications.<br />
Cheese is a major product for the<br />
<strong>Australian</strong> dairy industry, with sales<br />
of 205,000 tonnes within Australia, valued<br />
at an estimated A$1.7 billion, and export<br />
sales of 144,650 tonnes, worth more than<br />
A$789 million in 2008/09.<br />
Supermarket sales volumes returned<br />
to growth in the past year, up by nearly<br />
2% in 2008/09, with average retail prices<br />
increasing by 10% during the year.<br />
Cheddar cheese sales grew 1%, while the<br />
non-cheddar cheese types grew by 3%;<br />
continuing a slow but steady trend away<br />
from cheddar. Non-cheddar cheeses now<br />
make up a third of all supermarket sales –<br />
up from a quarter at the start of the decade.<br />
See Appendix 4 for more details<br />
of supermarket cheese sales.<br />
Cheese imports accounted for 22%<br />
of estimated domestic sales last year.<br />
<strong>In</strong> 2008/09, 72% of the 58,800 tonnes<br />
of cheese imported into Australia<br />
was sourced from New Zealand. The<br />
bulk of the remaining cheese imports<br />
came from Europe.<br />
Japan remained Australia’s most important<br />
overseas cheese market in 2008/09 and<br />
accounted for more than 50% of product<br />
exports, followed by the US, China, South<br />
Korea and Saudi Arabia. <strong>Australian</strong><br />
cheeses were exported to more than 65<br />
countries around the world last year.<br />
The trend away from cheddar cheeses<br />
to non-cheddar cheese types evident in the<br />
domestic market is also being reflected<br />
in Australia’s cheese exports; the noncheddar<br />
share of total export sales has<br />
steadily increased from 45% to 54% since<br />
the start of the decade.<br />
Table 14<br />
<strong>Australian</strong> cheese production by type of cheese<br />
2003/04 2004/05 2005/06 2006/07 2007/08 2008/09 (p)<br />
Cheddar 207,795 195,887 191,693 179,159 171,260 178,274<br />
Semi Hard 88,712 90,714 76,813 75,529 73,467 61,700<br />
Hard Grating 11,333 13,267 23,022 18,477 16,922 17,936<br />
Fresh 70,880 83,649 75,441 84,443 90,967 75,194<br />
Mould 5,042 4,833 5,847 6,030 7,968 8,912<br />
Total Cheese 383,762 388,350 372,816 363,638 360,584 342,016<br />
Source: <strong>Dairy</strong> manufacturers<br />
<strong>Australian</strong> <strong>Dairy</strong> <strong><strong>In</strong>dustry</strong> <strong>In</strong> <strong>Focus</strong> <strong>2009</strong> 27
Butter<br />
<strong>In</strong> 2008/09, Australia produced 148,500<br />
tonnes of butter and anhydrous milkfat<br />
(AMF) or butteroil in commercial butter<br />
equivalent terms (CBE) – a 16% increase<br />
on the previous year.<br />
AMF is butter with the water removed.<br />
It is primarily produced for export and<br />
domestic food processing applications,<br />
such as bakery and confectionery. While<br />
these sectors also use butter, the majority<br />
of domestic butter sales are through retail<br />
and foodservice outlets.<br />
The introduction of butter and vegetable<br />
oil-based dairy blends, which are easier<br />
to spread and lower in saturated fat, has<br />
helped to stabilise domestic market sales<br />
in the past two decades, after a sustained<br />
decline through the 1970s and 1980s.<br />
Nevertheless, Australia’s total retail<br />
market for tablespreads has generally<br />
shrunk over the past decade. Consumer<br />
concerns about margarine consumption<br />
have meant a continuing decline in share;<br />
with dairy spreads taking further retail<br />
market share from margarine. This<br />
has been a continuing trend over the<br />
decade, as dairyspreads’ share of the<br />
category has steadily increased from 30%<br />
in 2000/01 to 43% in 2008/09.<br />
It is estimated that some 45% of the<br />
domestic sales of <strong>Australian</strong> dairyspreads<br />
are through supermarkets. Supermarket<br />
sales volumes grew by 4% in 2008/09,<br />
despite average retail prices increasing<br />
10% during the year.<br />
See Appendix 4 for more details of supermarket<br />
butter and dairy blend sales.<br />
<strong>Australian</strong> exports of butter and AMF<br />
can vary significantly from year to year,<br />
depending on milk availability during<br />
the season and local company responses<br />
when strong world commodity prices<br />
are on offer in the market for competing<br />
products. Export volumes lifted 24%<br />
last year to 70,700 tonnes – worth A$232<br />
million. But this was from a very low level<br />
the previous year.<br />
Australia’s most important overseas<br />
markets for butter/AMF were Egypt,<br />
Singapore, China, the US and South Korea.<br />
See Appendix 5 for more details of butter<br />
and AMF exports.<br />
Table 15<br />
Butter and AMF production (tonnes)<br />
2003/04 2004/05 2005/06 2006/07 2007/08 2008/09 (p)<br />
Butter/Butter Blends (CBE) 104,143 105,131 92,850 101,666 99,202 109,753<br />
AMF (CBE) 44,754 41,528 52,904 31,434 28,416 38,742<br />
Source: <strong>Dairy</strong> manufacturers<br />
Table 16<br />
<strong>Australian</strong> exports of butter and AMF (tonnes)<br />
2003/04 2004/05 2005/06 2006/07 2007/08 (r) 2008/09 (p)<br />
Butter 41,942 37,900 35,525 44,279 34,636 44,108<br />
AMF (CBE) 41,201 31,611 46,816 36,689 22,516 26,594<br />
Source: <strong>Dairy</strong> Australia and ABS<br />
28<br />
<strong>Australian</strong> <strong>Dairy</strong> <strong><strong>In</strong>dustry</strong> <strong>In</strong> <strong>Focus</strong> <strong>2009</strong>
Fresh and frozen dairy products<br />
<strong>Australian</strong> manufacturers produce a range<br />
of fresh dairy products, including yogurts,<br />
dairy desserts, chilled custards and<br />
creams, dairy dips and frozen products<br />
such as ice-cream. To cater for the health<br />
concerns of modern consumers – a major<br />
driver in food choices – the majority<br />
of dairy products are available in<br />
low-fat formulations.<br />
The yogurt category has grown<br />
considerably for the dairy industry<br />
over the past two decades, due to their<br />
ability to meet consumer requirements<br />
for convenient, healthy snacks in an<br />
environment of time-poor lifestyles.<br />
The segment is dominated by strong<br />
international brands, such as Ski,<br />
Yoplait and Nestlé.<br />
Growth in yogurt sales has been<br />
underpinned by regular product<br />
innovation in the areas of packaging,<br />
flavour combinations and the use<br />
of probiotic cultures, as well as new<br />
products, such as drinking yogurts.<br />
Marketing support in terms<br />
of advertising new product ranges<br />
and flavour innovations is important<br />
in encouraging consumer trial and<br />
subsequent category growth.<br />
<strong>Dairy</strong> desserts are a low volume – high<br />
value dairy category with slowly declining<br />
volumes in recent years. Marketed as an<br />
indulgence or treat item, these products<br />
are generally targeted to adult consumers<br />
and include mousses, crème caramels<br />
and fromage fraïs. Children’s products<br />
include fromage fraïs and flavoured<br />
custards that often feature popular<br />
cartoon characters on-pack.<br />
Chilled custards, a traditional favourite,<br />
have shown marginal growth in recent<br />
years as manufacturers have expanded<br />
their product offerings into small,<br />
snack-sized, single-serve plastic<br />
cups sold in multi-packs.<br />
The overall market for cream has<br />
declined in recent years – although recent<br />
economic uncertainty has seen more<br />
people preparing meals at home and<br />
hence has supported sales. Regular and<br />
sour creams are both used extensively<br />
as accompaniments or ingredients, but<br />
are facing significant competition on the<br />
health front, often from other dairy<br />
products, such as natural yogurt.<br />
<strong>Dairy</strong> dips are another low volume – high<br />
value dairy category showing steady<br />
volume growth in recent years. Flavour<br />
innovations have been particularly<br />
successful in maintaining the consumer<br />
appeal of another traditional favourite<br />
in the dairy case.<br />
Australia’s consumption of ice-cream<br />
is relatively high by world standards –<br />
generally reported at 18 litres per head<br />
and third only to New Zealand and the<br />
US. The market is stable in volume terms,<br />
if highly seasonal in certain segments,<br />
stick lines particularly.<br />
The major market development in recent<br />
years has been premium indulgent<br />
treats, in both stick lines and smallersized<br />
take-home tubs. Refreshing fruitbased<br />
products are also popular with<br />
consumers seeking a healthy option<br />
within the category.<br />
Nevertheless, sales of larger tubs (2-litre<br />
or greater) and multi-packs of stick lines<br />
continue to make up the majority of sales<br />
in supermarkets, while mid-range stick<br />
lines and ice-cream cones are the major<br />
volume products in the route trade.<br />
Once again, strong international brands,<br />
such as Streets, Nestlé (Peters) and<br />
Cadbury, dominate the category.<br />
<strong>Australian</strong> <strong>Dairy</strong> <strong><strong>In</strong>dustry</strong> <strong>In</strong> <strong>Focus</strong> <strong>2009</strong> 29
Milk powders<br />
<strong>Australian</strong> manufacturers produce a range<br />
of milk powders. New technology in the<br />
production and use of powders has seen<br />
the range of specifications available from<br />
<strong>Australian</strong> manufacturers expand in line<br />
with customers’ needs.<br />
<strong>In</strong> the years up until the peak production<br />
season of 2001/02, the most obvious trend<br />
in powder production was an increase<br />
in wholemilk powder (WMP) output,<br />
with skim milk powder (SMP) production<br />
remaining relatively stable. Since 2002/03,<br />
production of milk powders have been<br />
most affected by the reduced availability<br />
of milk and the trend has changed. The<br />
production of both forms of powder fell<br />
sharply, followed by similar patterns<br />
of recovery, with WMP volumes making<br />
up nearly half the total milk powder<br />
production up until 2004/05. Strong<br />
commodity prices in recent years saw<br />
a significant re-balancing of company<br />
product mixes from 2005/06 towards<br />
SMP (and butter/butteroil) to take<br />
advantage of the higher relative export<br />
returns available from these products.<br />
2007/08 saw a trend back towards WMP;<br />
but this was reversed last year with SMP<br />
approaching 60% share of total milk<br />
powder production.<br />
Less than 15% of Australia’s powder<br />
production is sold domestically. Retail<br />
Figure 21<br />
<strong>Australian</strong> production and exports of skim milk powder (tonnes)<br />
Production 250,000<br />
Exports<br />
200,000<br />
Tonnes<br />
150,000<br />
100,000<br />
50,000<br />
0<br />
2003/04<br />
2004/05<br />
2005/06<br />
Figure 22<br />
<strong>Australian</strong> production and exports of wholemilk powder (tonnes)<br />
Production 200,000<br />
Exports<br />
150,000<br />
2006/07<br />
2007/08<br />
2008/09(p)<br />
Source: <strong>Dairy</strong> manufacturers and ABS<br />
Tonnes<br />
100,000<br />
50,000<br />
0<br />
2003/04<br />
2004/05<br />
2005/06<br />
2006/07<br />
2007/08<br />
2008/09(p)<br />
Source: <strong>Dairy</strong> manufacturers and ABS<br />
30<br />
<strong>Australian</strong> <strong>Dairy</strong> <strong><strong>In</strong>dustry</strong> <strong>In</strong> <strong>Focus</strong> <strong>2009</strong>
outlets account for only a small percentage<br />
of domestic sales, with local usage being<br />
mainly as a food ingredient.<br />
Exported milk powder is often recombined<br />
into liquid milk products, particularly<br />
in tropical climates where fresh milk<br />
supplies are not available. It is also<br />
used in bakery products (improving the<br />
volume and binding capacity of bread,<br />
and ensuring crisper pastry and biscuits),<br />
confectionery and milk chocolates,<br />
processed meats, ready-to-cook meals,<br />
baby foods, ice-cream, yogurt, health foods<br />
and reduced-fat milks. <strong>In</strong>dustrial-grade<br />
powder is used for animal fodder.<br />
The major export markets for <strong>Australian</strong><br />
milk powders are concentrated in Asia,<br />
with 79% of SMP export volumes and 65%<br />
of WMP destined for the region in 2008/09.<br />
See Appendix 5 for more<br />
details on powder exports.<br />
The Philippines was the largest single<br />
export market for <strong>Australian</strong> SMP,<br />
followed by China, Singapore, Malaysia<br />
and <strong>In</strong>donesia.<br />
China was the largest single export<br />
market for <strong>Australian</strong> WMP, followed<br />
by Singapore, <strong>In</strong>donesia, United Arab<br />
Emirates and Bangladesh.<br />
Table 17<br />
<strong>Australian</strong> production of milk powders (tonnes)<br />
2003/04 2004/05 2005/06 2006/07 2007/08 2008/09 (p)<br />
Skim milk powder 182,056 189,113 205,495 191,475 164,315 212,030<br />
Wholemilk powder* 186,860 189,220 158,250 135,364 141,974 147,544<br />
* includes infant powders Source: <strong>Dairy</strong> manufacturers<br />
Table 18<br />
<strong>Australian</strong> exports of skim milk powder by region (tonnes)<br />
2003/04 2004/05 2005/06 2006/07 2007/08 (r) 2008/09 (p)<br />
Asia 121,962 112,848 147,507 126,793 92,590 127,699<br />
Middle East 10,401 9,136 19,042 19,878 22,010 20,906<br />
Africa 4,847 6,352 3,704 6,023 2,353 6,180<br />
Pacific 315 725 1,032 1,258 509 514<br />
Americas 8,298 4,069 4,067 5,266 1,983 6,257<br />
Europe 354 98 235 1,111 313 525<br />
Others 0 0 17 0 0 0<br />
TOTAL 146,177 133,228 175,604 160,329 119,758 162,081<br />
Source: <strong>Dairy</strong> Australia and ABS<br />
Table 19<br />
<strong>Australian</strong> exports of wholemilk powder by region (tonnes)<br />
2003/04 2004/05 2005/06 2006/07 2007/08 (r) 2008/09 (p)<br />
Asia 127,188 114,566 123,039 99,837 90,208 102,024<br />
Middle East 21,354 24,232 10,420 18,499 12,151 30,889<br />
Africa 12,738 7,732 12,404 10,069 9,504 13,221<br />
Pacific 6,970 6,803 5,879 3,474 2,759 2,330<br />
Americas 3,452 6,713 13,068 11,111 10,327 9,548<br />
Europe 1,700 411 26 450 198 20<br />
Others 0 0 0 0 0 0<br />
Total 173,402 160,457 164,836 143,440 125,147 158,032<br />
*<strong>In</strong>cludes infant powders Source: <strong>Dairy</strong> Australia and ABS<br />
<strong>Australian</strong> <strong>Dairy</strong> <strong><strong>In</strong>dustry</strong> <strong>In</strong> <strong>Focus</strong> <strong>2009</strong> 31
Whey products and casein<br />
Whey is a by-product of the cheese<br />
making process. Traditionally, this<br />
product was disposed of in liquid<br />
form. However, recognition of the<br />
value of whey’s components has seen<br />
the production and utilisation of whey<br />
powders and protein concentrates increase<br />
significantly in recent years.<br />
Food-grade whey powder is used in the<br />
manufacture of ice-cream, bakery products<br />
(cakes, biscuits), chocolate flavouring,<br />
infant formula, yogurt, beverages and<br />
processed meat. <strong>In</strong>dustrial uses include<br />
animal feed (for pigs, horses and<br />
poultry), calf milk replacer and even<br />
as a carrier for herbicides.<br />
Whey protein concentrates are used<br />
in snack foods, juices, confectionery,<br />
ice-cream, biscuits, processed meats,<br />
(milk) protein drinks, desserts,<br />
infant foods and dietetic products.<br />
Products such as cosmetics, skin<br />
creams, bath salts and detergents also<br />
contain protein concentrates.<br />
Approximately 20% of Australia’s<br />
whey production is used domestically<br />
in the manufacture of infant formula,<br />
biscuits and ice-cream. The remainder<br />
is exported. China, Singapore, the<br />
Philippines, Thailand and Malaysia are<br />
the largest export markets for <strong>Australian</strong><br />
whey powders in 2008/09.<br />
Casein and caseinates are ingredients<br />
in noodles, chocolate, sweets,<br />
mayonnaise, ice-cream and cheese<br />
manufacture. They are used as binding<br />
ingredients, emulsifiers and milk<br />
substitutes in processed foods.<br />
<strong>In</strong>dustrial uses of casein and caseinates<br />
include: plastics (buttons, knitting<br />
needles); the manufacture of synthetic<br />
fibres and chemicals (plants, glues,<br />
glazed paper, putty and cosmetics);<br />
as a reinforcing agent and stabiliser<br />
for rubber in automobile tyres;<br />
a nutritional supplement and binder<br />
in calf milk replacers; and a range<br />
of other technical applications.<br />
The majority of Australia’s production<br />
of casein and caseinates is for export<br />
markets. The US and Japan have been the<br />
largest export markets in recent years.<br />
Figure 23<br />
Production and exports of whey products (tonnes)<br />
Production<br />
120,000<br />
Exports<br />
110,000<br />
100,000<br />
90,000<br />
80,000<br />
Tonnes<br />
70,000<br />
60,000<br />
50,000<br />
40,000<br />
30,000<br />
20,000<br />
10,000<br />
0<br />
2000/01<br />
2001/02<br />
2002/03<br />
2003/04<br />
2004/05<br />
2005/06<br />
2006/07<br />
2007/08<br />
2008/09(p)<br />
32<br />
<strong>Australian</strong> <strong>Dairy</strong> <strong><strong>In</strong>dustry</strong> <strong>In</strong> <strong>Focus</strong> <strong>2009</strong><br />
Source: <strong>Dairy</strong> manufacturers and ABS
<strong><strong>In</strong>dustry</strong> organisations and structure<br />
The <strong>Australian</strong> dairy industry<br />
is diverse, incorporating primary<br />
production, manufacturing and<br />
marketing. Accordingly, a number<br />
of bodies represent the various sectors<br />
and provide a framework for the<br />
industry to work together.<br />
<strong>Dairy</strong> Australia<br />
<strong>Dairy</strong> Australia is the industryowned<br />
national service organisation.<br />
<strong>For</strong>med on 1 July 2003, <strong>Dairy</strong> Australia<br />
replaced the <strong>Australian</strong> <strong>Dairy</strong><br />
Corporation and the <strong>Dairy</strong> Research<br />
and Development Corporation.<br />
<strong>Dairy</strong> Australia is a company limited<br />
by guarantee, operating under the<br />
Corporations Act 2001. It is fully accountable<br />
to its members – those levy payers who<br />
elect to become members – and the<br />
peak industry bodies.<br />
The structure provides farmers,<br />
as members, with a direct say in the<br />
activities of the organisation. To help<br />
the <strong>Australian</strong> dairy industry achieve<br />
its vision of growing an internationally<br />
competitive, innovative and sustainable<br />
industry, the organisation is delivering<br />
increased effectiveness through the<br />
integration and co-ordination of activities<br />
to provide better value for farmers’ levy<br />
investment. Together with the farmerpaid<br />
levy, the company receives matching<br />
Federal government research and<br />
development funds.<br />
Building platforms for successful<br />
collaboration across the dairy supply<br />
chain is at the heart of <strong>Dairy</strong> Australia’s<br />
mission to develop and drive industry<br />
services and innovation for the ultimate<br />
benefit of the <strong>Dairy</strong> Services Levy payers.<br />
The organisation does not limit its<br />
investment and services to direct farmbased<br />
activities, but works across the<br />
dairy supply chain – from farm through<br />
manufacturing to domestic and export<br />
markets – profitably linking business<br />
partners in order to:<br />
• increase returns, or reduce costs,<br />
to lift business margins;<br />
• deliver better or faster outcomes<br />
than businesses can achieve<br />
individually; and<br />
• improve understanding of the<br />
dynamics of change across the<br />
dairy chain<br />
to thereby boost the long-term<br />
sustainability and viability of local farm<br />
businesses and the regional communities<br />
that depend on dairy.<br />
<strong>For</strong> the current 2010-14 planning cycle,<br />
<strong>Dairy</strong> Australia’s core objectives are to:<br />
1. <strong>In</strong>crease farm productivity.<br />
2. Develop value-added, high-margin<br />
markets, channels and products.<br />
3. Promote and protect the unique<br />
benefits of <strong>Australian</strong> dairy.<br />
The organisation prepares an annual<br />
rolling five-year Strategic Plan. The<br />
current plan can be downloaded<br />
from www.dairyaustralia.com.au.<br />
<strong>Australian</strong> <strong>Dairy</strong> <strong><strong>In</strong>dustry</strong> <strong>In</strong> <strong>Focus</strong> <strong>2009</strong> 33
Figure 24<br />
<strong>Dairy</strong> Australia’s planned expenditure by business objectives for 2010 to 2014<br />
<strong>In</strong>crease farm productivity 45%<br />
Promote and protect the<br />
unique benefits of <strong>Australian</strong> dairy 23%<br />
Maintain and develop value-added,<br />
high-margin markets, channels and products 32%<br />
Source: <strong>Dairy</strong> Australia Strategic Plan 2010-14<br />
Figure 25<br />
<strong>Australian</strong> dairy industry organisations<br />
Manufacturing sector Farmer/Agri-political sector<br />
Farmers<br />
Service sector<br />
Group A members<br />
Manufacturing<br />
sector<br />
<strong>Australian</strong> <strong>Dairy</strong><br />
Products<br />
Federation (ADPF)<br />
State farmer<br />
organisations<br />
<strong>Australian</strong> <strong>Dairy</strong><br />
Farmers Ltd<br />
(ADF)<br />
<strong>Dairy</strong> Australia<br />
Limited<br />
<strong>Australian</strong> <strong>Dairy</strong><br />
<strong><strong>In</strong>dustry</strong> Council (ADIC)<br />
Group B members<br />
34<br />
<strong>Australian</strong> <strong>Dairy</strong> <strong><strong>In</strong>dustry</strong> <strong>In</strong> <strong>Focus</strong> <strong>2009</strong>
<strong>Australian</strong> <strong>Dairy</strong> <strong><strong>In</strong>dustry</strong> Council<br />
The <strong>Australian</strong> <strong>Dairy</strong> <strong><strong>In</strong>dustry</strong> Council<br />
(ADIC) is the dairy industry’s peak policy<br />
body. It co-ordinates industry policy<br />
and represents all sectors of the industry<br />
on national and international issues.<br />
The ADIC represents farmers, dairy<br />
product manufacturers and milk processors<br />
through its constituent organisations:<br />
• <strong>Australian</strong> <strong>Dairy</strong> Farmers Limited; and<br />
• <strong>Australian</strong> <strong>Dairy</strong> Products Federation.<br />
The ADIC has the task of bringing these<br />
bodies together to form a united view<br />
on issues affecting the dairy industry.<br />
<strong>Australian</strong> <strong>Dairy</strong> Farmers Limited<br />
<strong>Australian</strong> <strong>Dairy</strong> Farmers Limited<br />
(ADF) provides national representation<br />
for dairy farmers and forms the<br />
dairy commodity council of the<br />
National Farmers’ Federation.<br />
Its members include the six dairy farmer<br />
organisations, representing each state:<br />
• New South Wales Farmers’<br />
Association’s <strong>Dairy</strong> Committee<br />
NSWFA);<br />
• Queensland <strong>Dairy</strong>farmers’<br />
Organisation (QDO);<br />
• South <strong>Australian</strong> <strong>Dairy</strong>farmers’<br />
Association (SADA);<br />
• Tasmanian Farmers and Graziers<br />
Association’s <strong>Dairy</strong> Council (TFGA);<br />
• United <strong>Dairy</strong>farmers of Victoria<br />
(UDV); and<br />
• Western <strong>Australian</strong> Farmers’<br />
Federation’s <strong>Dairy</strong> Council (WAFF).<br />
<strong>Australian</strong> <strong>Dairy</strong><br />
Products Federation<br />
The <strong>Australian</strong> <strong>Dairy</strong> Products Federation<br />
(ADPF) is the national organisation<br />
representing the interests of dairy product<br />
manufacturers and traders. The ADPF’s<br />
primary purpose is to promote the<br />
interests of its members, and the dairy<br />
industry in general, to the <strong>Australian</strong><br />
and State Governments and other<br />
sectors of the community.<br />
State food safety organisations<br />
Each state has a food safety organisation<br />
to ensure that individual processors<br />
and dairy farmers comply with<br />
food safety standards.<br />
The <strong>Australian</strong> <strong>Dairy</strong> Authorities<br />
Standards Committee (ADASC), with<br />
representatives from each state food safety<br />
organisation, ensures there is a national<br />
approach to dairy food safety issues.<br />
ADASC is responsible for the <strong>Australian</strong><br />
Milk Residue Analysis (AMRA) survey.<br />
The six relevant state food safety<br />
organisations are:<br />
• New South Wales Food Authority;<br />
• Safe Food Queensland;<br />
• <strong>Dairy</strong> Authority of South Australia;<br />
• Tasmanian <strong>Dairy</strong> <strong><strong>In</strong>dustry</strong> Authority;<br />
• <strong>Dairy</strong> Food Safety Victoria; and<br />
• Department of Health, Western<br />
Australia <strong>Dairy</strong> Safety Unit.<br />
<strong>Australian</strong> <strong>Dairy</strong> <strong><strong>In</strong>dustry</strong> <strong>In</strong> <strong>Focus</strong> <strong>2009</strong> 35
<strong><strong>In</strong>dustry</strong> levies<br />
<strong>Dairy</strong> Services<br />
<strong>Dairy</strong> Australia is funded by farmerpaid<br />
levies that are imposed on the<br />
fat and protein content of all<br />
milk produced in Australia.<br />
The <strong>Australian</strong> Government matches<br />
expenditure on the industry’s research<br />
and development activities that<br />
meet established criteria.<br />
All <strong>Australian</strong> dairy farmers had the<br />
opportunity to participate, by mail, in the<br />
<strong>Dairy</strong> Poll 2007 conducted during February<br />
and March 2007. Compared to levy polls<br />
in other agricultural industries, a high<br />
participation rate of 53% was achieved.<br />
Some 68% of votes were cast in favour<br />
of maintaining the <strong>Dairy</strong> Service Levy<br />
at its current rate.<br />
Animal Health Australia<br />
<strong>Australian</strong> dairy farmers also contribute<br />
to the funding of Animal Health Australia<br />
(AHA), as do farmers in all other livestock<br />
industries. AHA is a non-profit public<br />
company limited by guarantee. Members<br />
include the <strong>Australian</strong>, state and territory<br />
governments, and key commodity and<br />
interest groups. AHA’s task is to facilitate<br />
partnerships between governments and<br />
livestock industries, and provide a national<br />
approach to animal health systems. The<br />
Animal Health Levy is the dairy industry’s<br />
contribution to AHA programs.<br />
<strong>Dairy</strong> Adjustment Authority<br />
As part of the <strong>Dairy</strong> Structural Adjustment<br />
Program (DSAP), the <strong>Dairy</strong> Adjustment<br />
Levy was imposed on domestic (retail)<br />
sales of products marketed as dairy<br />
beverages from 8 July 2000. The levy was<br />
removed by the Federal Government from<br />
23 February <strong>2009</strong> after repayment of the<br />
loans taken out to fund the DSAP.<br />
Table 20<br />
Average rate of milk levies for 2008/09<br />
Milkfat Protein Milk * Milksolids<br />
(cents/kg) (cents/kg) (cents/litre) (cents/kg)<br />
Animal Health 0.0373 0.0880 0.004 0.06<br />
<strong>Dairy</strong> Services 2.6075 6.3558 0.321 4.28<br />
* Based on average 2007/08 <strong>Australian</strong> milk composition of 4.15% milkfat and 3.35% protein<br />
36<br />
<strong>Australian</strong> <strong>Dairy</strong> <strong><strong>In</strong>dustry</strong> <strong>In</strong> <strong>Focus</strong> <strong>2009</strong>
Appendices<br />
1. Regions 38<br />
2. Milk production 39<br />
3. Manufacturing processes 40<br />
4. Supermarket sales 43<br />
5. Exports 46<br />
6. Imports 51<br />
<strong>In</strong>dex 52<br />
<strong>Australian</strong> <strong>Dairy</strong> <strong><strong>In</strong>dustry</strong> <strong>In</strong> <strong>Focus</strong> <strong>2009</strong> 37
Appendix 1 – Regions<br />
Darwin<br />
Northern Territory<br />
Cairns<br />
Queensland<br />
South Australia<br />
Brisbane<br />
Western Australia<br />
New South Wales<br />
Perth<br />
<strong>Dairy</strong> Farming Areas by<br />
Regional Development Program<br />
Adelaide<br />
Victoria<br />
Melbourne<br />
Sydney<br />
A.C.T.<br />
Canberra<br />
<strong>Dairy</strong> NSW<br />
<strong>Dairy</strong> SA<br />
<strong>Dairy</strong> TAS<br />
Gipps<strong>Dairy</strong><br />
Murray <strong>Dairy</strong><br />
Subtropical <strong>Dairy</strong><br />
WestVic <strong>Dairy</strong><br />
Western <strong>Dairy</strong><br />
Hobart<br />
Tasmania<br />
38<br />
<strong>Australian</strong> <strong>Dairy</strong> <strong><strong>In</strong>dustry</strong> <strong>In</strong> <strong>Focus</strong> <strong>2009</strong>
Appendix 2 – Milk production<br />
Figure A1<br />
Seasonality of milk production (million litres)<br />
2008/09<br />
Average 2003/04 – 2007/08<br />
New South Wales<br />
Victoria<br />
150<br />
1,000<br />
125<br />
800<br />
Million litres<br />
100<br />
75<br />
50<br />
Million litres<br />
600<br />
400<br />
25<br />
200<br />
0<br />
Jul<br />
Aug<br />
Sep<br />
Oct<br />
0<br />
Jul<br />
Aug<br />
Nov<br />
Dec<br />
Jan<br />
Feb<br />
Mar<br />
Apr<br />
May<br />
Jun<br />
Queensland<br />
Nov<br />
Dec<br />
Jan<br />
Feb<br />
Mar<br />
Apr<br />
May<br />
Jun<br />
Sep<br />
Oct<br />
South Australia<br />
80<br />
80<br />
60<br />
60<br />
Million litres<br />
40<br />
Million litres<br />
40<br />
20<br />
20<br />
0<br />
Jul<br />
Aug<br />
0<br />
Jul<br />
Aug<br />
Sep<br />
Oct<br />
Nov<br />
Dec<br />
Western Australia<br />
Jan<br />
Feb<br />
Mar<br />
Apr<br />
May<br />
Jun<br />
Sep<br />
Oct<br />
Nov<br />
Dec<br />
Jan<br />
Feb<br />
Mar<br />
Apr<br />
May<br />
Jun<br />
Tasmania<br />
50<br />
100<br />
40<br />
80<br />
Million litres<br />
30<br />
20<br />
Million litres<br />
60<br />
40<br />
10<br />
Sep<br />
Oct<br />
Nov<br />
Dec<br />
Jan<br />
Feb<br />
Mar<br />
Apr<br />
May<br />
Jun<br />
20<br />
0<br />
Jul<br />
Aug<br />
0<br />
Jul<br />
Aug<br />
Sep<br />
Oct<br />
Nov<br />
Dec<br />
Jan<br />
Feb<br />
Mar<br />
Apr<br />
May<br />
Jun<br />
<strong>Australian</strong> <strong>Dairy</strong> <strong><strong>In</strong>dustry</strong> <strong>In</strong> <strong>Focus</strong> <strong>2009</strong> 39
Appendix 3 – Manufacturing processes<br />
The milkfat and solids contained in<br />
manufacturing milk can be used to<br />
produce a wide variety of dairy products.<br />
There are four major production processes.<br />
The first two are for butter/skim milk<br />
powder production and butter/casein<br />
production, which are joint product<br />
processes. The other two are whole milk<br />
powder production and cheese production.<br />
Furthermore, for each of these separate<br />
product lines, other dairy products can be<br />
made from the residual milk components.<br />
The first step in making butter is to<br />
separate whole milk into cream and skim<br />
milk. The liquid skim milk is evaporated<br />
and spray dried to produce skim milk<br />
powder (SMP). The cream is churned<br />
until the fat globules form into solid<br />
butter, and leaving a liquid by-product,<br />
buttermilk. This liquid can be dried to<br />
make buttermilk powder (BMP).<br />
There are various ways of making casein.<br />
A common method is to set the skim milk<br />
by mixing with acid to produce curd. The<br />
curd is shaken to remove large clumps.<br />
The remaining liquid whey by-product is<br />
removed and the curd is repeatedly rinsed<br />
in water and then drained. Excess moisture<br />
is extracted by pressing the curd. It is then<br />
milled and dried. The curd is broken down<br />
to particle size by grinding it and passing<br />
it through a sieve.<br />
Table A1<br />
Product composition<br />
% fat % SNF<br />
Skim milk powder 1.0 94.5<br />
Butter 80.5 2.0<br />
Ghee 99.6 0.1<br />
Casein 1.5 88.5<br />
Wholemilk powder 26.0 70.4<br />
Cheddar cheese 33.0 31.0<br />
Gouda 31.5 23.5<br />
Edam 21.2 31.8<br />
Parmesan 21.8 46.2<br />
Cottage cheese 4.0 16.0<br />
Brie 25.0 25.0<br />
Mozzarella 23.1 30.9<br />
Whole milk powder (WMP) is made<br />
by evaporating milk that has had some<br />
of the cream removed. The evaporated<br />
milk is concentrated and dried either<br />
by roller or spray process to form a<br />
powder. Spray drying is more commonly<br />
used and involves spraying a fine mist<br />
of concentrated milk into a current of<br />
hot air to form granules of powder. The<br />
granules can be treated with steam to<br />
“instantise” the powder and make it easier<br />
to reconstitute into milk.<br />
Cheese production techniques vary<br />
substantially. To make cheddar cheese,<br />
some of the cream is removed from the<br />
pasteurised milk. Starter culture is added<br />
to the milk to produce both acid and<br />
flavour. Then rennet is added to form<br />
Figure A2<br />
Product yield from 10,000 litres of milk 2008/09<br />
10,000 litres milk<br />
415kg fat<br />
335kg protein<br />
880kg SNF<br />
Butter/SMP<br />
893kg SMP<br />
501kg butter<br />
50kg BMP<br />
Butter/casein<br />
303kg casein<br />
501kg butter<br />
50kg BMP<br />
WMP<br />
1,274kg WMP<br />
105kg butter<br />
11kg BMP<br />
Cheddar<br />
1,065kg cheddar<br />
30kg butter<br />
3kg BMP<br />
623kg whey pdr<br />
40<br />
<strong>Australian</strong> <strong>Dairy</strong> <strong><strong>In</strong>dustry</strong> <strong>In</strong> <strong>Focus</strong> <strong>2009</strong>
curd and whey. The curd is cut, heated<br />
and stirred to allow the whey to drain. A<br />
process called cheddaring then takes place,<br />
and involves the curd being allowed to mat<br />
together, before it is milled, salted, pressed<br />
and packed. The cheese is stored to<br />
develop the desired maturity and flavour.<br />
The longer it is stored, the stronger the<br />
flavour. Mild cheddar is matured for about<br />
three months, semi-matured cheddar for<br />
three to six months and mature or tasty<br />
cheddar for up to a year.<br />
The liquid whey extracted during cheese<br />
manufacture contains protein, lactose and<br />
a little fat. It can be dried to make products<br />
for pharmaceutical purposes, as a useful<br />
supplement in stock feed, and in the<br />
manufacture of ice-cream.<br />
The cream from standardisation of milk<br />
for wholemilk powder, casein and cheddar<br />
production can be used to make butter<br />
and BMP.<br />
Table A2<br />
<strong>Australian</strong> cheese production by state (tonnes)<br />
NSW VIC QLD SA WA TAS AUST<br />
1979/80 12,720 91,308 11,054 17,895 2,886 15,328 151,191<br />
1989/90 14,198 103,216 12,842 22,774 4,129 18,172 175,331<br />
1999/00 26,441 239,029 26,011 40,782 7,680 33,399 373,342<br />
2000/01 23,443 257,006 22,672 33,541 7,305 32,510 376,477<br />
2001/02 24,836 285,239 24,618 36,120 8,473 32,776 412,063<br />
2002/03 22,686 259,399 22,569 28,364 8,411 37,538 378,966<br />
2003/04 19,748 268,433 23,520 26,463 8,481 37,117 383,762<br />
2004/05 22,453 270,651 18,447 33,562 7,357 35,880 388,350<br />
2005/06 21,140 268,925 7,308 31,394 6,411 37,638 372,816<br />
2006/07 22,690 266,102 4,542 29,503 2,618 38,183 363,638<br />
2007/08 (e) 24,591 268,207 2,888 17,964 2,596 44,340 360,586<br />
2008/09 (p) 26,584 244,882 1,958 16,886 4,041 47,665 342,016<br />
Source: <strong>Dairy</strong> manufacturers<br />
Table A3<br />
<strong>Australian</strong> production of dairy products (tonnes)<br />
Butter* AMF (CBE) SMP WMP** Whey Products<br />
1989/90 78,053 26,105 130,976 56,476 19,895<br />
1999/00 110,325 71,295 236,322 186,653 66,258<br />
2000/01 103,145 69,175 244,442 205,449 61,452<br />
2001/02 108,308 70,045 239,489 238,684 88,785<br />
2002/03 103,377 60,343 196,608 198,306 99,384<br />
2003/04 104,143 44,754 182,056 186,860 105,390<br />
2004/05 105,131 41,528 189,113 189,220 105,225<br />
2005/06 92,850 52,904 205,495 158,250 98,436<br />
2006/07 101,666 31,434 191,475 135,364 86,198<br />
2007/08 (e) 99,202 28,416 164,315 141,974 82,652<br />
2008/09 (p) 109,753 38,742 212,030 147,544 81,136<br />
Source: <strong>Dairy</strong> manufacturers *<strong>In</strong>cludes butter blends as CBE ** <strong>In</strong>cludes infant powders<br />
<strong>Australian</strong> <strong>Dairy</strong> <strong><strong>In</strong>dustry</strong> <strong>In</strong> <strong>Focus</strong> <strong>2009</strong> 41
Table A4<br />
<strong>Australian</strong> cheese production by variety (tonnes)<br />
2003/04 2004/05 2005/06 2006/07 2007/08 2008/09 (p)<br />
Cheddar & Cheddar Types<br />
Cheddar (1) 176,120 172,942 159,921 148,845 135,929 149,183<br />
Reduced fat cheddar 27,074 17,368 26,943 22,287 26,754 23,689<br />
Cheedam 1,884 1,085 833 541 28 260<br />
Other cheddar type cheese (2) 2,717 4,492 3,996 7,486 8,549 5,142<br />
Total Cheddar 207,795 195,887 191,693 179,159 171,260 178,274<br />
Semi Hard Cheese<br />
Mozzarella 54,628 57,186 52,603 54,117 54,705 42,120<br />
Pizza 8,681 5,573 5,581 4,573 4,957 5,017<br />
Other stretch curd and shredding 6,775 9,312 4,807 2,835 2,087 1,498<br />
Edam 484 267 123 158 709 279<br />
Gouda 12,151 11,310 6,450 6,818 8,040 8,885<br />
Other eye type cheese (3) 1,980 3,652 3,607 3,552 2,344 2,145<br />
Other semi hard cheese (4) 4,013 3,414 3,642 3,476 626 1,756<br />
Total Semi Hard Cheese 88,712 90,714 76,813 75,529 73,468 61,700<br />
Hard Grating Types<br />
Parmesan 5,009 5,072 8,462 8,631 9,981 10,633<br />
Pecorino 1,537 840 892 1,536 2,039 940<br />
Romano 1,328 2,256 2,854 2,028 1,637 1,957<br />
Other (5) 3,459 5,099 10,814 6,282 3,265 4,406<br />
Total 11,333 13,267 23,022 18,477 16,922 17,936<br />
Fresh Types<br />
Cottage 2,806 2,692 2,490 2,488 2,582 2,529<br />
Cream cheese 46,817 57,235 50,022 58,161 62,267 47,399<br />
Fetta 4,576 5,875 5,195 5,668 5,908 5,843<br />
Neufchatel 7,293 7,909 8,681 9,270 9,521 8,730<br />
Ricotta 3,009 4,948 4,402 5,376 6,892 7,266<br />
Other fresh types (6) 6,379 4,990 4,651 3,480 3,798 3,428<br />
Total 70,880 83,649 75,441 84,443 90,968 75,195<br />
Mould Ripened<br />
Blue Vein 836 848 1,062 1,025 1,436 1,709<br />
Brie and Camembert 1,738 1,736 2,247 4,602 5,975 6,486<br />
Other mould ripened 2,468 2,249 2,538 403 557 716<br />
Total 5,042 4,833 5,847 6,030 7,968 8,911<br />
Total Cheese 383,762 388,350 372,816 363,638 360,586 342,016<br />
(1) <strong>In</strong>cludes: Vintage (2) <strong>In</strong>cludes: Colby, Cheshire, Gloucester, Lancashire, Leicester, Nimbin and semi processed cheddar<br />
(3) <strong>In</strong>cludes: Swiss, Emmenthal, Fontina, Havarti, Samsoe, Tilsit, Buetten, Vacherin. (4) <strong>In</strong>cludes: Bakers, Casalinga, Goya.<br />
(5) <strong>In</strong>cludes: Fresh Pecorino, Melbourno, Pepato, Parmagiano. (6) <strong>In</strong>cludes: Quark, Stracchino, Mascarpone.<br />
Revisions due to reclassification of cheeses and revisions of specialty cheese production<br />
Source: <strong>Dairy</strong> manufacturers<br />
42<br />
<strong>Australian</strong> <strong>Dairy</strong> <strong><strong>In</strong>dustry</strong> <strong>In</strong> <strong>Focus</strong> <strong>2009</strong>
Appendix 4 – Supermarket sales<br />
Milk<br />
Table A5<br />
Supermarket milk sales by state (million litres)<br />
NSW VIC QLD SA WA TAS AUST<br />
2006/07 (r) 300 268 230 100 102 25 1,025<br />
2007/08 (r) 317 276 255 102 106 26 1,082<br />
2008/09 (p) 327 284 269 105 106 27 1,118<br />
Source: Synovate Aztec<br />
Table A6<br />
Supermarket milk sales by type (million litres)<br />
Regular Reduced fat Low fat Flavoured UHT AUST<br />
2006/07 (r) 450 320 69 63 122 1,025<br />
2007/08 (r) 488 333 66 67 127 1,082<br />
2008/09 (p) 509 346 62 70 132 1,118<br />
Source: Synovate Aztec<br />
Table A7<br />
Supermarket milk sales – branded vs private label<br />
2006/07 (r) 2007/08 (r) 2008/09<br />
Million Price/ Million Price/ Million Price/<br />
litres Litre litres Litre litres Litre<br />
Branded Milk<br />
Regular whole 139 $1.57 147 $1.74 152 $1.86<br />
Reduced fat 192 $1.80 184 $2.01 178 $2.10<br />
No fat 67 $1.85 63 $2.06 59 $2.14<br />
Flavoured 60 $2.98 64 $3.33 67 $3.71<br />
UHT 77 $1.78 82 $1.90 86 $1.90<br />
Total Branded Milk 535 $1.87 540 $2.08 542 $2.20<br />
Private Label<br />
Regular whole 311 $1.13 341 $1.16 357 $1.18<br />
Reduced fat 127 $1.29 149 $1.34 167 $1.35<br />
Low fat 3 $1.58 3 $1.63 3 $1.64<br />
Flavoured 3 $1.91 3 $1.95 3 $2.12<br />
UHT 45 $1.14 46 $1.18 46 $1.19<br />
Total Private Label Milk 490 $1.18 542 $1.22 577 $1.24<br />
Total Milk 1,025 $1.54 1,082 $1.65 1,118 $1.71<br />
Source: Synovate Aztec<br />
<strong>Australian</strong> <strong>Dairy</strong> <strong><strong>In</strong>dustry</strong> <strong>In</strong> <strong>Focus</strong> <strong>2009</strong> 43
Cheese<br />
Table A8<br />
Supermarket cheese sales by type (tonnes)<br />
2006/07 (r) 2007/08 (r) 2008/09<br />
Cheddar<br />
Natural cheddar 66,695 67,386 68,057<br />
Processed cheddar 19,163 18,834 18,853<br />
Total Cheddar 85,858 86,220 86,910<br />
Non-Cheddar<br />
Eye 3,755 3,472 3,512<br />
Shredding 7,344 7,786 8,273<br />
Hard grating 4,126 4,223 4,335<br />
Fresh 20,483 20,007 20,591<br />
Mould ripened 4,677 4,789 4,668<br />
Other non-cheddar 1,643 1,504 1,750<br />
Total Non-Cheddar 42,027 41,781 43,129<br />
Total Cheese 127,885 128,001 130,039<br />
Source: Synovate Aztec<br />
Table A9<br />
Supermarket cheese sales by pack size<br />
2006/07 (r) 2007/08 (r) 2008/09<br />
Tonnes Price per kg Tonnes Price per kg Tonnes Price per kg<br />
250 gram 24,065 $13.37 25,500 $14.68 24,462 $16.08<br />
500 gram 39,177 $9.23 37,864 $10.18 38,206 $11.19<br />
1 kilogram 18,252 $7.26 16,278 $8.21 15,214 $9.16<br />
Other sizes 46,392 $15.11 48,358 $16.09 52,157 $17.55<br />
Total Cheese 127,885 $11.86 128,001 $13.06 130,039 $14.42<br />
Source: Synovate Aztec<br />
Table A10<br />
Supermarket cheese sales by form<br />
2006/07 (r) 2007/08 (r) 2008/09<br />
Tonnes Price per kg Tonnes Price per kg Tonnes Price per kg<br />
Blocks 55,696 $12.16 55,411 $13.78 55,263 $15.40<br />
Bulk Deli 7,589 $12.97 5,197 $14.42 4,670 $15.64<br />
Shredded/grated 22,611 $10.98 23,347 $11.89 24,968 $13.01<br />
Slices 25,688 $10.25 26,093 $11.35 26,333 $12.47<br />
Tubs/jars 11,995 $11.37 11,825 $12.29 11,491 $13.30<br />
Others 4,306 $21.64 6,127 $18.62 7,314 $19.78<br />
Total Cheese 127,885 $11.86 128,001 $13.06 130,039 $14.42<br />
Source: Synovate Aztec<br />
44<br />
<strong>Australian</strong> <strong>Dairy</strong> <strong><strong>In</strong>dustry</strong> <strong>In</strong> <strong>Focus</strong> <strong>2009</strong>
Tablespreads<br />
Table A11<br />
Supermarket tablespreads sales by type<br />
2006/07 (r) 2007/08 (r) 2008/09<br />
Tonnes Price per kg Tonnes Price per kg Tonnes Price per kg<br />
<strong>Dairy</strong><br />
Butter 16,236 $6.61 17,145 $7.38 18,573 $7.94<br />
Blends 20,163 $6.76 20,444 $7.39 20,455 $8.24<br />
Ghee 331 $4.50 327 $4.72 297 $4.81<br />
Total <strong>Dairy</strong> Spreads 36,730 $6.67 37,916 $7.36 39,326 $8.07<br />
Source: Synovate Aztec<br />
Table A12<br />
Supermarket dairy spreads sales by pack size<br />
2006/07 (r) 2007/08 (r) 2008/09<br />
Tonnes Price per kg Tonnes Price per kg Tonnes Price per kg<br />
250 gram 7,480 $6.71 8,318 $7.46 9,169 $8.13<br />
375 gram 6,598 $8.33 6,213 $9.54 6,524 $10.49<br />
500 gram 22,275 $6.09 22,515 $6.60 22,829 $7.29<br />
Other sizes 377 $11.58 870 $10.59 804 $10.12<br />
Total <strong>Dairy</strong> Spreads 36,730 $6.67 37,916 $7.36 39,326 $8.07<br />
Source: Synovate Aztec<br />
Table A13<br />
Supermarket dairy spreads sales by form<br />
2006/07 (r) 2007/08 (r) 2008/09<br />
Tonnes Price per kg Tonnes Price per kg Tonnes Price per kg<br />
Pats 12,961 $5.81 13,840 $6.47 14,796 $6.90<br />
Tubs 23,748 $7.13 24,051 $7.86 24,505 $8.76<br />
Others 21 $20.99 25 $23.71 25 $25.62<br />
Total <strong>Dairy</strong> Spreads 36,730 $6.67 37,916 $7.36 39,326 $8.07<br />
Source: Synovate Aztec<br />
Total dairy category<br />
Figure A3<br />
Supermarket dairy category sales – 12 months to December 2008<br />
<strong>In</strong>fant formula/powdered milk 2%<br />
<strong>Dairy</strong> dips 3%<br />
Butter and dairy blends 5%<br />
Ice-cream 12%<br />
Chilled cream and custard 4%<br />
Milk – white 28%<br />
Milk – flavoured 4%<br />
Evaporated/condensed milks 1%<br />
Cheese 26%<br />
Yogurt and dairy desserts 15%<br />
Source: AC Neilsen<br />
<strong>Australian</strong> <strong>Dairy</strong> <strong><strong>In</strong>dustry</strong> <strong>In</strong> <strong>Focus</strong> <strong>2009</strong> 45
Appendix 5 – Exports<br />
Table A14<br />
<strong>Australian</strong> exports of cheese (tonnes)<br />
2003/04 2004/05 2005/06 2006/07 2007/08 (r) 2008/09 (p)<br />
Asia<br />
China, Hong Kong 6,728 6,857 8,180 10,123 11,079 7,410<br />
<strong>In</strong>donesia 5,223 6,792 6,061 7,678 4,028 2,547<br />
Japan 92,625 106,549 81,047 95,879 96,846 74,380<br />
Korea, South 13,137 10,365 8,936 8,327 6,859 7,045<br />
Malaysia 2,301 3,103 3,476 3,465 3,877 3,858<br />
Philippines 3,693 4,953 3,381 3,316 4,390 3,174<br />
Singapore 2,526 2,445 2,832 3,667 3,814 4,098<br />
Taiwan 6,384 5,844 5,399 5,464 5,842 3,778<br />
Thailand 948 999 1,215 1,587 1,958 1,993<br />
Other Asia 1,162 1,372 1,522 1,144 1,040 629<br />
Total Asia 113,795 134,726 149,279 122,049 140,650 139,871<br />
Middle East<br />
Saudi Arabia 14,911 17,081 20,708 18,066 16,355 5,359<br />
United Arab Emirates 3,209 3,513 4,130 4,057 3,619 1,735<br />
Other Middle East 7,535 9,321 11,499 10,468 8,877 4,051<br />
Total Middle East 25,655 29,915 36,337 32,591 28,851 11,145<br />
Africa<br />
Algeria 4,872 3,179 4,417 2,342 1,460 935<br />
Egypt 1,404 1,996 1,921 2,784 1,948 2,095<br />
Other Africa 3,246 2,669 2,864 2,794 2,510 1,429<br />
Total Africa 9,522 7,844 9,202 7,920 5,918 4,459<br />
Pacific<br />
New Zealand 1,714 2,415 2,761 2,665 4,352 2,652<br />
Others 801 714 765 604 660 511<br />
Total Pacific 2,515 3,129 3,526 3,269 5,012 3,163<br />
Americas<br />
Caribbean 1,317 799 940 540 201 953<br />
United States 10,261 11,931 11,807 14,044 8,719 9,347<br />
Others 4,535 2,782 2,136 1,820 1,065 831<br />
Total Americas 16,113 15,512 14,883 16,404 9,985 11,131<br />
Europe<br />
Eastern Europe 306 467 139 424 831 386<br />
EU (27) 23,095 21,273 15,566 11,056 12,073 5,691<br />
Other Europe 36 60 0 0 0 0<br />
Total Europe 23,437 21,800 15,705 11,480 12,904 6,077<br />
46<br />
Total 211,969 227,479 201,702 212,314 202,403 144,887<br />
Source: <strong>Dairy</strong> Australia and ABS<br />
<strong>Australian</strong> <strong>Dairy</strong> <strong><strong>In</strong>dustry</strong> <strong>In</strong> <strong>Focus</strong> <strong>2009</strong>
Table A15<br />
<strong>Australian</strong> exports of wholemilk powder (tonnes)*<br />
2003/04 2004/05 2005/06 2006/07 2007/08 (r) 2008/09 (p)<br />
Asia<br />
Bangladesh 5,257 6,137 7,344 6,898 2,072 10,740<br />
China, Hong Kong 8,330 3,414 7,146 6,546 13,212 21,668<br />
<strong>In</strong>donesia 12,729 13,642 24,676 20,575 15,196 16,979<br />
Japan 2,832 1,307 669 580 204 482<br />
Malaysia 28,110 28,708 25,843 20,895 17,816 9,084<br />
Philippines 16,567 15,168 6,985 4,160 4,420 3,607<br />
Singapore 10,187 12,725 17,080 15,259 17,841 18,195<br />
Sri Lanka 11,486 7,200 10,721 6,430 4,341 6,051<br />
Taiwan 17,958 15,341 10,754 5,769 3,962 5,538<br />
Thailand 7,267 6,025 5,784 6,702 5,236 5,012<br />
Others 6,465 4,899 6,038 6,022 5,908 4,668<br />
Total Asia 127,188 114,566 123,040 99,836 90,208 102,024<br />
Africa 12,738 7,732 12,403 10,070 9,504 13,221<br />
Americas 3,452 6,713 13,069 11,111 10,327 9,548<br />
Europe 1,700 411 26 450 198 20<br />
Middle East 21,354 24,232 10,419 18,500 12,151 30,889<br />
Pacific 6,970 6,803 5,879 3,474 2,759 2,330<br />
Total 173,402 160,457 164,836 143,441 125,147 158,032<br />
*Also includes infant powder Source: <strong>Dairy</strong> Australia and ABS<br />
Table A16<br />
<strong>Australian</strong> exports of skim milk powder (tonnes)<br />
2003/04 2004/05 2005/06 2006/07 2007/08 (r) 2008/09 (p)<br />
Asia<br />
China, Hong Kong 10,688 9,056 7,284 8,754 9,737 12,488<br />
<strong>In</strong>donesia 14,972 13,700 17,232 15,394 15,500 12,924<br />
Japan 2,461 3,414 3,914 1,329 610 6,985<br />
Malaysia 22,087 22,018 25,648 24,265 14,223 14,912<br />
Philippines 24,151 17,686 25,407 15,828 13,345 25,426<br />
Singapore 16,968 20,670 20,128 22,961 15,859 17,134<br />
Taiwan 10,072 8,182 10,284 9,580 5,827 6,264<br />
Thailand 7,932 8,250 26,844 17,897 11,642 9,511<br />
Others 12,631 9,872 10,767 10,785 5,848 22,055<br />
Total Asia 121,962 112,848 147,507 126,793 92,590 127,699<br />
Africa 4,847 6,352 3,704 6,023 2,353 6,180<br />
Americas 8,298 4,069 4,067 5,266 1,983 6,257<br />
Europe 354 98 235 1,111 313 525<br />
Middle East 10,401 9,136 19,042 19,878 22,010 20,906<br />
Pacific 315 725 1,032 1,258 509 514<br />
Others 0 0 17 0 0 0<br />
Total 146,177 133,228 175,604 160,329 119,758 162,081<br />
Source: <strong>Dairy</strong> Australia and ABS<br />
<strong>Australian</strong> <strong>Dairy</strong> <strong><strong>In</strong>dustry</strong> <strong>In</strong> <strong>Focus</strong> <strong>2009</strong> 47
Table A17<br />
<strong>Australian</strong> exports of butter* (tonnes)<br />
2003/04 2004/05 2005/06 2006/07 2007/08 (r) 2008/09 (p)<br />
Asia<br />
China, Hong Kong 3,245 2,769 2,251 3,393 3,692 3,236<br />
Japan 2,318 2,172 1,550 2,279 4,388 2,374<br />
Korea, South 5,759 7,708 3,018 4,810 3,955 2,623<br />
Malaysia 1,918 1,474 1,490 1,470 1,640 1,828<br />
Singapore 4,275 5,378 3,256 4,142 4,918 3,901<br />
Taiwan 1,611 1,112 1,321 1,178 1,211 1,119<br />
Others 1,479 1,358 1,518 1,905 1,176 1,704<br />
Total Asia 20,605 21,971 14,404 19,177 20,980 16,785<br />
Middle East<br />
Saudi Arabia 1,275 360 1,256 1,742 1,357 679<br />
United Arab Emirates 414 275 939 2,494 1,355 1,881<br />
Others 2,982 2,209 1,135 1,489 1,043 4,725<br />
Total Middle East 4,671 2,844 3,330 5,725 3,755 7,285<br />
Africa<br />
Mauritius 264 256 189 219 227 149<br />
North Africa 2,436 2,924 3,926 6,273 1550 10,674<br />
Others 391 58 140 156 60 306<br />
Total Africa 3,091 3,238 4,255 6,648 1,837 11,129<br />
Pacific 250 591 1,085 998 462 855<br />
Americas 2,403 3,331 4,233 1,952 423 1,207<br />
Europe 10,922 5,925 8,219 9,779 7179 6,847<br />
Total 41,942 37,900 35,526 44,279 34,636 44,108<br />
* <strong>In</strong>cludes butter blends<br />
Source: <strong>Dairy</strong> Australia and ABS<br />
48<br />
<strong>Australian</strong> <strong>Dairy</strong> <strong><strong>In</strong>dustry</strong> <strong>In</strong> <strong>Focus</strong> <strong>2009</strong>
Table A18<br />
<strong>Australian</strong> exports of butteroil (tonnes)<br />
2003/04 2004/05 2005/06 2006/07 2007/08 (r) 2008/09 (p)<br />
Asia<br />
Bangladesh 453 403 151 119 85 252<br />
<strong>In</strong>donesia 818 370 1,975 1,025 571 1,444<br />
Malaysia 2,241 1,557 2,682 2,385 2621 1,571<br />
Philippines 721 755 1,210 885 294 1,446<br />
Singapore 2,227 1,358 3,932 2,181 1623 969<br />
Others 9,409 6,835 6,168 7,389 4,735 4,174<br />
Total Asia 15,869 11,278 16,118 13,984 9,929 9,856<br />
Middle East<br />
Kuwait 1,070 486 137 0 14 202<br />
United Arab Emirates 2,245 2,164 2,060 2,029 1,958 321<br />
Others 3,028 897 2,394 1,515 678 1,244<br />
Total Middle East 6,343 3,547 4,591 3,544 2,650 1,767<br />
Africa 1,888 2,018 2,100 1,979 69 1,344<br />
Americas 7,406 6,559 13,240 9,061 4329 7,823<br />
Europe 1,526 1,851 1,518 838 972 450<br />
Pacific 135 194 120 129 176 168<br />
Total 33,167 25,447 37,687 29,535 18,125 21,408<br />
Source: <strong>Dairy</strong> Australia and ABS<br />
Table A19<br />
<strong>Australian</strong> exports of liquid milk (tonnes)<br />
2003/04 2004/05 2005/06 2006/07 2007/08 (r) 2008/09 (p)<br />
Asia<br />
Singapore 18,531 16,689 18,012 18,281 17,277 19,036<br />
Philippines 5,413 7,250 9,600 9,763 5,809 2,762<br />
Malaysia 3,996 3,628 3,650 4,531 3,246 3,346<br />
<strong>In</strong>donesia 1,603 1,726 1,386 1,635 1,544 635<br />
Hong Kong 14,431 15,839 17,075 17,326 15,600 17,325<br />
China 882 777 694 344 384 1,924<br />
Other Asia 7,484 7,657 6,575 6,823 4,842 4,123<br />
Total Asia 52,341 53,565 56,992 58,701 48,702 49,151<br />
Africa 1,941 3,419 1,059 928 792 538<br />
Pacific 12,629 11,888 12,055 9,323 10,321 9,734<br />
Others 283 1,007 0 238 115 570<br />
Total 67,194 69,879 70,107 69,192 59,931 59,993<br />
Source: <strong>Dairy</strong> Australia and ABS<br />
<strong>Australian</strong> <strong>Dairy</strong> <strong><strong>In</strong>dustry</strong> <strong>In</strong> <strong>Focus</strong> <strong>2009</strong> 49
Table A20<br />
<strong>Australian</strong> exports of whey products* (tonnes)<br />
2003/04 2004/05 2005/06 2006/07 2007/08 (r) 2008/09 (p)<br />
Asia<br />
Malaysia 5,237 5,202 5,385 4,281 3,594 5,166<br />
<strong>In</strong>donesia 11,558 12,548 12,419 12,486 8,024 5,040<br />
Philippines 14,517 11,678 9,099 5,419 4,878 7,796<br />
Japan 5,443 4,801 1,906 2,251 2,257 3,483<br />
China 17,783 12,396 8,759 8,108 6,630 12,240<br />
Hong Kong 717 879 975 596 361 363<br />
Singapore 4,448 9,087 9,846 7,470 5,279 8,052<br />
Taiwan 2,103 2,244 2,322 1,595 1,117 1,366<br />
Thailand 3,544 5,998 8,824 7,369 5,885 6,236<br />
Other Asia 5,445 6,322 5,128 3,065 3,339 4,286<br />
Total Asia 70,795 71,155 64,663 52,641 41,363 54,028<br />
Europe 83 764 2,404 1,408 467 436<br />
Other 10,623 10,309 9,114 9,169 9,100 10,811<br />
Total 81,502 82,229 76,181 63,218 50,930 65,275<br />
* <strong>In</strong>cludes whey protein concentrate<br />
Source: <strong>Dairy</strong> Australia and ABS<br />
Table A21<br />
<strong>Australian</strong> exports of other milk products* (tonnes)<br />
2003/04 2004/05 2005/06 2006/07 2007/08 (r) 2008/09 (p)<br />
Asia<br />
China 1,024 3,858 1,157 1,134 7,608 852<br />
Japan 7,904 3,068 3,249 4,842 4,132 2,659<br />
<strong>In</strong>donesia 1,613 3,626 2,661 3,140 2,194 2,403<br />
Malaysia 1,717 813 1,006 1,295 1,214 594<br />
Philippines 4,445 5,122 7,327 4,206 3,116 4,012<br />
Singapore 5,013 6,365 7,384 3,748 3,566 2,400<br />
Thailand 2,477 1,157 1,371 3,070 1,416 1,099<br />
Other Asia 7,479 3,186 3,253 4,278 5,539 2,527<br />
Total Asia 31,671 27,196 27,409 25,713 28,784 16,546<br />
Americas 18,775 13,661 7,305 7,228 5,285 2,933<br />
Europe 2,108 8,393 4,086 5,345 2,045 700<br />
Other 2,208 1,978 2,151 2,701 2,764 4,496<br />
Total 54,762 51,228 40,951 40,988 38,879 24,675<br />
* <strong>In</strong>cludes buttermilk powder, casein, milk protein concentrate, lactose and milk powder combinations<br />
Source: <strong>Dairy</strong> Australia and ABS<br />
50<br />
<strong>Australian</strong> <strong>Dairy</strong> <strong><strong>In</strong>dustry</strong> <strong>In</strong> <strong>Focus</strong> <strong>2009</strong>
Appendix 6 – Imports<br />
Table A22<br />
Imports of dairy products from New Zealand and other countries (tonnes)<br />
New Total New Total<br />
Zealand Other 2007/08 Zealand Other 2008/09<br />
Skim milk powder 3,051 531 3,582 3,788 42 3,830<br />
Buttermilk powder 144 1,915 2,059 109 1,842 1,951<br />
Wholemilk powder* 6,648 9,579 16,227 9,000 5,722 14,722<br />
Whey powder & concentrates 2,028 6,414 8,442 2,322 11,507 13,829<br />
Condensed milk 258 1,825 2,083 77 1,918 1,995<br />
Milk 3,980 14 3,994 5,329 0 5,329<br />
Cream 1,751 7 1,758 1,762 3 1,765<br />
Yogurt 563 80 643 586 132 718<br />
Butter** 15,699 2,246 17,945 11,471 576 12,047<br />
Butter oil 1,914 433 2,347 947 403 1,350<br />
Mixtures 5,253 4,711 9,964 9,685 5,999 15,684<br />
Cheese 49,230 20,516 69,746 42,758 16,083 58,841<br />
Casein 1,207 143 1,350 870 128 998<br />
Caseinates 306 16 322 222 21 243<br />
Lactose 1,399 7,977 9,376 3,575 7,796 11,371<br />
Ice cream (’000 lts) 5,215 10,905 16,120 3,693 10,689 14,382<br />
* <strong>In</strong>cludes infant powder ** <strong>In</strong>cludes butter blends converted at the rate of 1kg butter blend = 0.7kg butter Source: ABS<br />
Table A23<br />
Cheese imports by country (tonnes)<br />
2003/04 2004/05 2005/06 2006/07 2007/08 2008/09 (p)<br />
Austria 59 158 202 315 330 359<br />
Bulgaria 1,223 1,545 1,615 1,655 1,700 1,345<br />
Denmark 1,904 2,188 2,464 2,163 2,068 2,072<br />
France 795 692 762 884 933 799<br />
Germany 438 396 356 463 194 251<br />
Greece 1,118 1,113 1,146 1,296 1,298 1,504<br />
Italy 2,158 2,059 2,401 2,401 2,803 2,756<br />
Netherlands 1,087 1,061 1,139 1,291 1,157 1,227<br />
Poland 89 381 374 463 412 452<br />
United Kingdom 171 193 172 222 153 185<br />
Other 273 256 416 272 589 611<br />
Total EU 9,316 10,042 11,047 11,425 11,637 11,561<br />
New Zealand 37,568 37,994 47,195 50,529 49,230 42,758<br />
United States 11 43 20 51 6,718 2,358<br />
Norway 1,620 1,815 1,817 1,831 1,857 1,770<br />
Switzerland 72 81 112 104 128 115<br />
Other 104 321 150 330 175 279<br />
Total Cheese Imports 48,690 50,296 60,341 64,270 69,745 58,841<br />
Source: ABS (Exclude goats cheese)<br />
<strong>Australian</strong> <strong>Dairy</strong> <strong><strong>In</strong>dustry</strong> <strong>In</strong> <strong>Focus</strong> <strong>2009</strong> 51
52<br />
<strong>In</strong>dex<br />
ABARE Farm Survey 15<br />
anhydrous milk fat (AMF) 28, 41<br />
Animal Health Australia 36<br />
Animal Health Levy 36<br />
Asian dairy sector 7–8, 23, 31, 32<br />
<strong>Australian</strong> <strong>Dairy</strong> Authorities Standards<br />
Committee (ADASC) 35<br />
<strong>Australian</strong> <strong>Dairy</strong> Farmers Limited 35<br />
<strong>Australian</strong> <strong>Dairy</strong> Herd Improvement Service<br />
(ADHIS) 12<br />
<strong>Australian</strong> dairy industry 2, 9–10<br />
comparison with other agricultural<br />
sectors 9–10<br />
as important rural industry 2, 9<br />
long-term trends 9<br />
situation and outlook 2, 3–8<br />
value of 2, 9<br />
as world competitive industry 10<br />
<strong>Australian</strong> <strong>Dairy</strong> <strong><strong>In</strong>dustry</strong> Council (ADIC) 35<br />
<strong>Australian</strong> dairy industry organisations 33–5<br />
<strong>Australian</strong> <strong>Dairy</strong> Products Federation (ADPF)<br />
35<br />
<strong>Australian</strong> Export <strong>In</strong>dex 13–14<br />
<strong>Australian</strong> market situation and outlook 7–8<br />
<strong>Australian</strong> milk, utilisation 21<br />
<strong>Australian</strong> Milk Residue Analysis (AMRA)<br />
survey 35<br />
butter 21, 28<br />
consumption 24<br />
exports 28<br />
exports by region 48<br />
manufacture 40, 41<br />
production 28<br />
buttermilk powder (BMP) 21, 40, 41<br />
butteroil<br />
exports 28, 49<br />
production 28<br />
casein/caseinates 21, 32, 40<br />
challenges facing farmers 6<br />
cheddar cheese 27<br />
manufacture 40–1<br />
production 42<br />
cheese 21, 27<br />
consumption 24<br />
domestic sales 27<br />
export sales 27<br />
exports by region 46<br />
imports 27, 51<br />
production by state 41<br />
production by type 27, 42<br />
production techniques 40–1<br />
supermarket sales 27, 44<br />
chilled custards 21, 29<br />
confidence in the future of the industry 5<br />
co-operatives 21<br />
cream 29, 41<br />
currency movements, impact on exports 4<br />
<strong>Dairy</strong> <strong>2009</strong>: Situation and Outlook 2, 3–8<br />
<strong>Australian</strong> market situation and outlook<br />
7–8<br />
challenges facing the local industry 6<br />
confidence in the future of the industry 5<br />
expectations of growth and production 6<br />
expected production growth in three<br />
years time 5<br />
industry in October <strong>2009</strong> 3–4<br />
world demand improves as economy<br />
recovers 6–7<br />
world supply response to growing<br />
demand 8<br />
<strong>Dairy</strong> Adjustment Levy 26, 36<br />
<strong>Dairy</strong> Australia 2, 33–4, 36<br />
dairy blends 28<br />
dairy breeds 12<br />
dairy companies 21, 26<br />
dairy cow numbers, by state 12<br />
dairy desserts 21, 29<br />
dairy dips 29<br />
dairy farm financial performance 15, 16<br />
dairy farming areas 38<br />
dairy farms, number registered 11<br />
dairy manufacturing 21<br />
dairy markets 22–3<br />
by product 22<br />
dairy products<br />
<strong>Australian</strong> market situation and outlook<br />
7–8<br />
export returns 14<br />
imports 51<br />
production 41<br />
<strong>Dairy</strong> Services Levy 33, 36<br />
dairy spreads 28, 45<br />
<strong>Dairy</strong> Structural Adjustment Program<br />
(DSAP) 36<br />
dairying, location and types 9, 11<br />
domestic consumption 22, 24<br />
domestic market 8<br />
drinking milk 18, 21, 25–6<br />
pack sizes 26<br />
per capita consumption 24<br />
price 26<br />
production 18, 19, 20<br />
sales by state 25<br />
sales by type 25<br />
supermarket sales 26, 43<br />
drought 9, 15, 17<br />
European Union (EU) dairy sector 8, 22<br />
exporters’ share of world dairy trade 23<br />
exports 4, 8, 22–3<br />
butter 28, 48<br />
butteroil 28, 49<br />
by destination 23<br />
casein 32<br />
cheese 27, 46<br />
liquid milk 49<br />
milk powders 30, 31, 47, 50<br />
other milk products 50<br />
spot prices 3<br />
whey products 32, 50<br />
factory paid prices 14, 15<br />
farm business returns 15<br />
farm cash income 15<br />
farm facts 11–16<br />
farm management practices 18<br />
farm numbers 12<br />
farmgate milk prices 2, 3–4, 12–13, 15<br />
international 10<br />
fresh products 29<br />
fresh type cheeses, production 42<br />
frozen products 29<br />
growth expectations in production 6<br />
hard grating cheeses, production 42<br />
herd size 12<br />
ice-cream 29<br />
imports<br />
cheese 27, 51<br />
dairy products 51<br />
industry levies 36<br />
industry organisations and structure 33–5<br />
international commodity prices 4<br />
international farmgate milk prices 10<br />
liquid milk, exports 49<br />
manufacturing milk production 18, 19, 20<br />
manufacturing processes 40–2<br />
margarine 28<br />
milk composition by state 19<br />
milk levies 36<br />
milk powders 21, 30–1<br />
exports 30, 31, 47, 50<br />
production 30, 31<br />
milk production 2, 17–20<br />
average annual per cow 12, 13<br />
average annual per farm 12<br />
by region 39<br />
by state 18, 19, 20<br />
seasonality 17, 18, 39<br />
versus indices of farms and cows<br />
milked 17<br />
mould-ripened cheeses, production 42<br />
National <strong>Dairy</strong> Farmer Survey<br />
3–4, 5–6, 11, 12<br />
neutriceuticals 21<br />
New Zealand dairy sector 8, 10, 22<br />
per capita consumption of dairy products 24<br />
product yield from 10,000 litres of milk 40<br />
protein/fat composition of milk by state 19<br />
semi-hard cheeses, production 42<br />
skim milk powder (SMP) 21, 40<br />
exports 30, 31, 47<br />
production 30, 31<br />
South American production 8<br />
State food safety organisations 35<br />
supermarket sales<br />
cheese 27, 44<br />
dairy spreads 45<br />
drinking milk 26, 43<br />
growth by dairy category 7<br />
ice-cream 29<br />
tablespreads 45<br />
total dairy category 45<br />
tablespreads 28, 45<br />
UHT milk 21, 26<br />
United States dairy sector 8<br />
whey products 32, 41<br />
exports 32, 50<br />
production 32<br />
whey protein concentrates 21, 32<br />
wholemilk powder (WMP) 21, 40<br />
exports 30, 31, 47<br />
production 30, 31<br />
world demand improves for dairy 6–7<br />
world supply response to growing demand 8<br />
yield per cow 12<br />
yogurt 21, 29<br />
consumption 24
<strong>Dairy</strong> Australia<br />
ABN 60 105 227 987<br />
Level 5, IBM Centre<br />
60 City Rd<br />
Southbank Victoria 3006 Australia<br />
T + 61 3 9694 3777<br />
F + 61 3 9694 3733<br />
E enquiries@dairyaustralia.com.au<br />
www.dairyaustralia.com.au<br />
Memberline 1800 004 377