Australian Dairy Industry In Focus 2009 - Dairying For Tomorrow
Australian Dairy Industry In Focus 2009 - Dairying For Tomorrow
Australian Dairy Industry In Focus 2009 - Dairying For Tomorrow

You also want an ePaper? Increase the reach of your titles
YUMPU automatically turns print PDFs into web optimized ePapers that Google loves.
The trends in farm numbers have<br />
meant that the average herd size has<br />
increased from 85 cows in 1980 to over<br />
200 in 2008/09.<br />
Analysis of the 2008 National <strong>Dairy</strong><br />
Farmer Survey indicated that 8% of dairy<br />
farms had herd sizes of more than 500<br />
cows and produced 25% of the total<br />
milk produced in Australia. At the other<br />
end of the spectrum, 48% of farms had<br />
fewer than 200 cows and produced<br />
24% of the milk.<br />
The dominant dairy breed in Australia<br />
is the Holstein Friesian, accounting for<br />
approximately 67% of all dairy cattle,<br />
followed by the Jersey at more than 10%<br />
and then the Holstein/Jersey cross. More<br />
than 85% of dairy farmers use artificial<br />
insemination and access some of the best<br />
genetic material in the world.<br />
The genetic evaluation of dairy cattle<br />
is conducted by the <strong>Australian</strong> <strong>Dairy</strong><br />
Herd Improvement Service (ADHIS),<br />
using one of the most sophisticated<br />
evaluation systems available.<br />
Improvements in herd genetics, pasture<br />
management practices and supplementary<br />
feeding regimes have seen the average<br />
yield per cow increase from 2,850 litres<br />
a year to around 5,750 litres over the past<br />
three decades. Combining this increase<br />
in yield per cow with the increase<br />
in average herd size, the average annual<br />
milk production per farm has increased<br />
from 247,000 litres to 1,185,000 litres over<br />
the same period.<br />
Unlike many countries around the world,<br />
there is no legislative control over the<br />
price milk processing companies pay<br />
farmers for their milk. Farmgate prices<br />
vary between manufacturers, with<br />
individual company returns being affected<br />
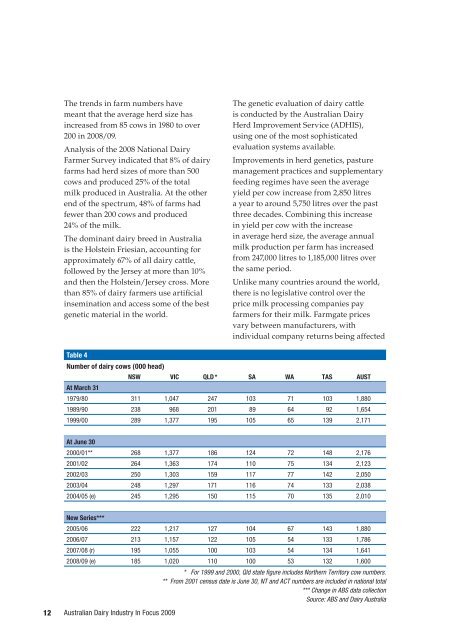
Table 4<br />
Number of dairy cows (000 head)<br />
NSW VIC QLD * SA WA TAS AUST<br />
At March 31<br />
1979/80 311 1,047 247 103 71 103 1,880<br />
1989/90 238 968 201 89 64 92 1,654<br />
1999/00 289 1,377 195 105 65 139 2,171<br />
At June 30<br />
2000/01** 268 1,377 186 124 72 148 2,176<br />
2001/02 264 1,363 174 110 75 134 2,123<br />
2002/03 250 1,303 159 117 77 142 2,050<br />
2003/04 248 1,297 171 116 74 133 2,038<br />
2004/05 (e) 245 1,295 150 115 70 135 2,010<br />
12<br />
New Series***<br />
2005/06 222 1,217 127 104 67 143 1,880<br />
2006/07 213 1,157 122 105 54 133 1,786<br />
2007/08 (r) 195 1,055 100 103 54 134 1,641<br />
2008/09 (e) 185 1,020 110 100 53 132 1,600<br />
* <strong>For</strong> 1999 and 2000, Qld state figure includes Northern Territory cow numbers.<br />
** From 2001 census date is June 30, NT and ACT numbers are included in national total<br />
*** Change in ABS data collection<br />
Source: ABS and <strong>Dairy</strong> Australia<br />
<strong>Australian</strong> <strong>Dairy</strong> <strong><strong>In</strong>dustry</strong> <strong>In</strong> <strong>Focus</strong> <strong>2009</strong>