Australian Dairy Industry In Focus 2009 - Dairying For Tomorrow
Australian Dairy Industry In Focus 2009 - Dairying For Tomorrow
Australian Dairy Industry In Focus 2009 - Dairying For Tomorrow

Create successful ePaper yourself
Turn your PDF publications into a flip-book with our unique Google optimized e-Paper software.
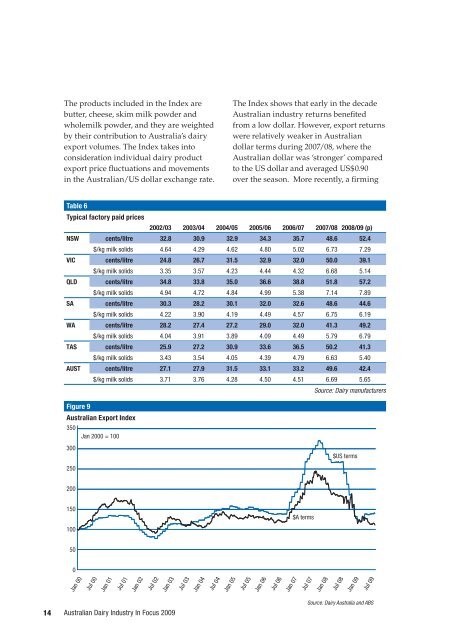
The products included in the <strong>In</strong>dex are<br />
butter, cheese, skim milk powder and<br />
wholemilk powder, and they are weighted<br />
by their contribution to Australia’s dairy<br />
export volumes. The <strong>In</strong>dex takes into<br />
consideration individual dairy product<br />
export price fluctuations and movements<br />
in the <strong>Australian</strong>/US dollar exchange rate.<br />
The <strong>In</strong>dex shows that early in the decade<br />
<strong>Australian</strong> industry returns benefited<br />
from a low dollar. However, export returns<br />
were relatively weaker in <strong>Australian</strong><br />
dollar terms during 2007/08, where the<br />
<strong>Australian</strong> dollar was ‘stronger’ compared<br />
to the US dollar and averaged US$0.90<br />
over the season. More recently, a firming<br />
Table 6<br />
Typical factory paid prices<br />
2002/03 2003/04 2004/05 2005/06 2006/07 2007/08 2008/09 (p)<br />
NSW cents/litre 32.8 30.9 32.9 34.3 35.7 48.6 52.4<br />
$/kg milk solids 4.64 4.29 4.62 4.80 5.02 6.73 7.29<br />
VIC cents/litre 24.8 26.7 31.5 32.9 32.0 50.0 39.1<br />
$/kg milk solids 3.35 3.57 4.23 4.44 4.32 6.68 5.14<br />
QLD cents/litre 34.8 33.8 35.0 36.6 38.8 51.8 57.2<br />
$/kg milk solids 4.94 4.72 4.84 4.99 5.38 7.14 7.89<br />
SA cents/litre 30.3 28.2 30.1 32.0 32.6 48.6 44.6<br />
$/kg milk solids 4.22 3.90 4.19 4.49 4.57 6.75 6.19<br />
WA cents/litre 28.2 27.4 27.2 29.0 32.0 41.3 49.2<br />
$/kg milk solids 4.04 3.91 3.89 4.09 4.49 5.79 6.79<br />
TAS cents/litre 25.9 27.2 30.9 33.6 36.5 50.2 41.3<br />
$/kg milk solids 3.43 3.54 4.05 4.39 4.79 6.63 5.40<br />
AUST cents/litre 27.1 27.9 31.5 33.1 33.2 49.6 42.4<br />
$/kg milk solids 3.71 3.76 4.28 4.50 4.51 6.69 5.65<br />
Source: <strong>Dairy</strong> manufacturers<br />
Figure 9<br />
<strong>Australian</strong> Export <strong>In</strong>dex<br />
350<br />
Jan 2000 = 100<br />
300<br />
$US terms<br />
250<br />
200<br />
150<br />
$A terms<br />
100<br />
50<br />
0<br />
Jan 00<br />
Jul 00<br />
Jan 01<br />
Jul 01<br />
Jan 02<br />
Jul 02<br />
Jan 03<br />
Jul 03<br />
Jan 04<br />
Jul 04<br />
Jan 05<br />
Jul 05<br />
Jan 06<br />
Jul 06<br />
Jan 07<br />
Jul 07<br />
Jan 08<br />
Jul 08<br />
Jan 09<br />
Jul 09<br />
14<br />
<strong>Australian</strong> <strong>Dairy</strong> <strong><strong>In</strong>dustry</strong> <strong>In</strong> <strong>Focus</strong> <strong>2009</strong><br />
Source: <strong>Dairy</strong> Australia and ABS