Exam style questions - Hodder Plus Home
Exam style questions - Hodder Plus Home
Exam style questions - Hodder Plus Home

You also want an ePaper? Increase the reach of your titles
YUMPU automatically turns print PDFs into web optimized ePapers that Google loves.
1 2 4 6 6 6 7<br />
Finally add a key.<br />
6 3 = 63<br />
2 2 3 5 6 7 7<br />
3 1 4 5 6 8 8 9<br />
4 0 0 1 3 5 8<br />
5 2 2 7 9<br />
6 0 3 5<br />
7 1<br />
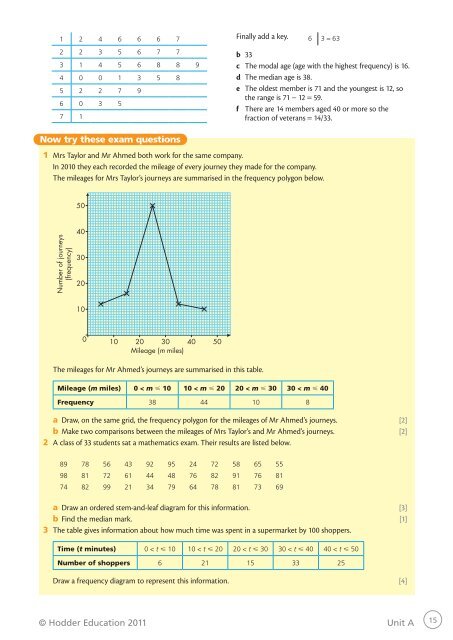
b 33<br />
c The modal age (age with the highest frequency) is 16.<br />
d The median age is 38.<br />
e The oldest member is 71 and the youngest is 12, so<br />
the range is 71 − 12 = 59.<br />
f There are 14 members aged 40 or more so the<br />
fraction of veterans = 14/33.<br />
Now try these exam <strong>questions</strong><br />
1 Mrs Taylor and Mr Ahmed both work for the same company.<br />
In 2010 they each recorded the mileage of every journey they made for the company.<br />
The mileages for Mrs Taylor’s journeys are summarised in the frequency polygon below.<br />
50<br />
Number of journeys<br />
(frequency)<br />
40<br />
30<br />
20<br />
10<br />
0<br />
10 20 30 40 50<br />
Mileage (m miles)<br />
The mileages for Mr Ahmed’s journeys are summarised in this table.<br />
Mileage (m miles) 0 < m 10 10 < m 20 20 < m 30 30 < m 40<br />
Frequency 38 44 10 8<br />
a Draw, on the same grid, the frequency polygon for the mileages of Mr Ahmed’s journeys. [2]<br />
b Make two comparisons between the mileages of Mrs Taylor’s and Mr Ahmed’s journeys. [2]<br />
2 A class of 33 students sat a mathematics exam. Their results are listed below.<br />
89 78 56 43 92 95 24 72 58 65 55<br />
98 81 72 61 44 48 76 82 91 76 81<br />
74 82 99 21 34 79 64 78 81 73 69<br />
a Draw an ordered stem-and-leaf diagram for this information. [3]<br />
b Find the median mark. [1]<br />
3 The table gives information about how much time was spent in a supermarket by 100 shoppers.<br />
Time (t minutes) 0 < t 10 10 < t 20 20 < t 30 30 < t 40 40 < t 50<br />
Number of shoppers 6 21 15 33 25<br />
Draw a frequency diagram to represent this information. [4]<br />
© <strong>Hodder</strong> Education 2011 Unit A<br />
15