Exam style questions - Hodder Plus Home
Exam style questions - Hodder Plus Home
Exam style questions - Hodder Plus Home

Create successful ePaper yourself
Turn your PDF publications into a flip-book with our unique Google optimized e-Paper software.
a How far does Tom live from school [1]<br />
b Write down the time that Tom arrives at the<br />
school. [1]<br />
c Tom stopped three times on the journey. For<br />
how many minutes was he at the last stop [1]<br />
d Calculate his speed in km/h between 8.20 a.m.<br />
and 8.30 a.m. [3]<br />
3 Steve goes from home to school by walking to a<br />
bus stop and then catching a school bus.<br />
Use the information below to construct a<br />
distance–time graph for Steve’s journey.<br />
Steve left home at 8.00 a.m.<br />
He walked at 6 km/h for<br />
10 minutes.<br />
He then waited for 5 minutes before<br />
catching the bus.<br />
The bus took him a further 8 km to<br />
school at a steady speed of 32 km/h. [4]<br />
4 The graph below describes a real-life situation.<br />
Describe a possible situation that is occurring. [3]<br />
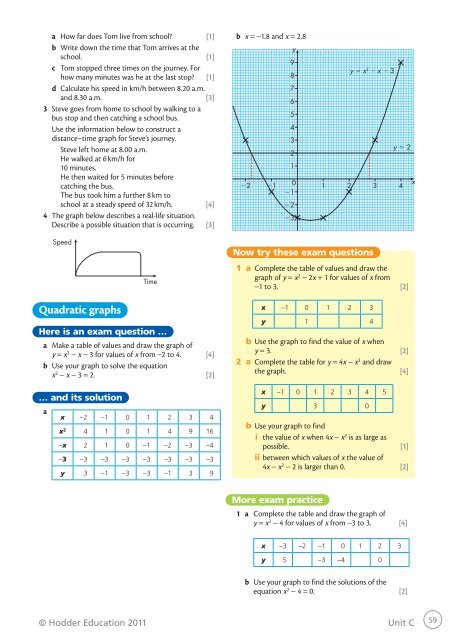
b x = −1.8 and x = 2.8<br />
y<br />
9<br />
8<br />
y x 2 x 3<br />
7<br />
6<br />
5<br />
4<br />
3<br />
y 2<br />
2 1<br />
2<br />
1<br />
0<br />
x<br />
1 2 3 4<br />
1<br />
2<br />
3<br />
Speed<br />
Time<br />
Now try these exam <strong>questions</strong><br />
1 a Complete the table of values and draw the<br />
graph of y = x 2 − 2x + 1 for values of x from<br />
−1 to 3. [2]<br />
Quadratic graphs<br />
Here is an exam question …<br />
a Make a table of values and draw the graph of<br />
y = x 2 − x − 3 for values of x from −2 to 4. [4]<br />
b Use your graph to solve the equation<br />
x 2 − x − 3 = 2. [2]<br />
… and its solution<br />
a<br />
x −2 −1 0 1 2 3 4<br />
x 2 4 1 0 1 4 9 16<br />
−x 2 1 0 −1 −2 −3 −4<br />
−3 −3 −3 −3 −3 −3 −3 −3<br />
y 3 −1 −3 −3 −1 3 9<br />
x –1 0 1 2 3<br />
y 1 4<br />
b Use the graph to find the value of x when<br />
y = 3. [2]<br />
2 a Complete the table for y = 4x − x 2 and draw<br />
the graph. [4]<br />
x −1 0 1 2 3 4 5<br />
y 3 0<br />
b Use your graph to find<br />
i the value of x when 4x − x 2 is as large as<br />
possible. [1]<br />
ii between which values of x the value of<br />
4x − x 2 − 2 is larger than 0. [2]<br />
More exam practice<br />
1 a Complete the table and draw the graph of<br />
y = x 2 − 4 for values of x from −3 to 3. [4]<br />
x −3 −2 −1 0 1 2 3<br />
y 5 −3 −4 0<br />
b Use your graph to find the solutions of the<br />
equation x 2 − 4 = 0. [2]<br />
© <strong>Hodder</strong> Education 2011 Unit C<br />
59