Exam style questions - Hodder Plus Home
Exam style questions - Hodder Plus Home
Exam style questions - Hodder Plus Home

Create successful ePaper yourself
Turn your PDF publications into a flip-book with our unique Google optimized e-Paper software.
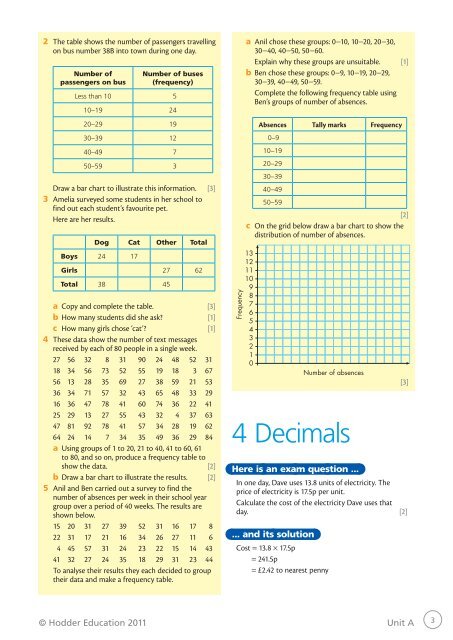
2 The table shows the number of passengers travelling<br />
on bus number 38B into town during one day.<br />
Number of<br />
passengers on bus<br />
Number of buses<br />
(frequency)<br />
Less than 10 5<br />
10−19 24<br />
20−29 19<br />
30−39 12<br />
40–49 7<br />
50–59 3<br />
Draw a bar chart to illustrate this information. [3]<br />
3 Amelia surveyed some students in her school to<br />
find out each student’s favourite pet.<br />
Here are her results.<br />
Dog Cat Other Total<br />
Boys 24 17<br />
Girls 27 62<br />
Total 38 45<br />
a Copy and complete the table. [3]<br />
b How many students did she ask [1]<br />
c How many girls chose ‘cat’ [1]<br />
4 These data show the number of text messages<br />
received by each of 80 people in a single week.<br />
27 56 32 8 31 90 24 48 52 31<br />
18 34 56 73 52 55 19 18 3 67<br />
56 13 28 35 69 27 38 59 21 53<br />
36 34 71 57 32 43 65 48 33 29<br />
16 36 47 78 41 60 74 36 22 41<br />
25 29 13 27 55 43 32 4 37 63<br />
47 81 92 78 41 57 34 28 19 62<br />
64 24 14 7 34 35 49 36 29 84<br />
a Using groups of 1 to 20, 21 to 40, 41 to 60, 61<br />
to 80, and so on, produce a frequency table to<br />
show the data. [2]<br />
b Draw a bar chart to illustrate the results. [2]<br />
5 Anil and Ben carried out a survey to find the<br />
number of absences per week in their school year<br />
group over a period of 40 weeks. The results are<br />
shown below.<br />
15 20 31 27 39 52 31 16 17 8<br />
22 31 17 21 16 34 26 27 11 6<br />
4 45 57 31 24 23 22 15 14 43<br />
41 32 27 24 35 18 29 31 23 44<br />
To analyse their results they each decided to group<br />
their data and make a frequency table.<br />
Frequency<br />
a Anil chose these groups: 0−10, 10−20, 20−30,<br />
30−40, 40−50, 50−60.<br />
Explain why these groups are unsuitable. [1]<br />
b Ben chose these groups: 0−9, 10−19, 20−29,<br />
30−39, 40−49, 50−59.<br />
Complete the following frequency table using<br />
Ben’s groups of number of absences.<br />
Absences Tally marks Frequency<br />
0−9<br />
10−19<br />
20−29<br />
30−39<br />
40−49<br />
50−59<br />
[2]<br />
c On the grid below draw a bar chart to show the<br />
distribution of number of absences.<br />
13<br />
12<br />
11<br />
10<br />
9<br />
8<br />
7<br />
6<br />
5<br />
4<br />
3<br />
2<br />
1<br />
0<br />
4 Decimals<br />
Here is an exam question ...<br />
In one day, Dave uses 13.8 units of electricity. The<br />
price of electricity is 17.5p per unit.<br />
Calculate the cost of the electricity Dave uses that<br />
day. [2]<br />
... and its solution<br />
Cost = 13.8 × 17.5p<br />
= 241.5p<br />
= £2.42 to nearest penny<br />
Number of absences<br />
[3]<br />
© <strong>Hodder</strong> Education 2011 Unit A<br />
3