Exam style questions - Hodder Plus Home
Exam style questions - Hodder Plus Home
Exam style questions - Hodder Plus Home

You also want an ePaper? Increase the reach of your titles
YUMPU automatically turns print PDFs into web optimized ePapers that Google loves.
<strong>Exam</strong> <strong>questions</strong>: Unit B<br />
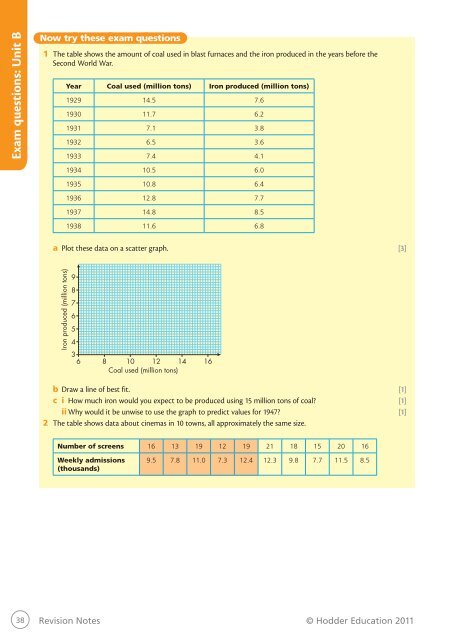
Now try these exam <strong>questions</strong><br />
1 The table shows the amount of coal used in blast furnaces and the iron produced in the years before the<br />
Second World War.<br />
Year Coal used (million tons) Iron produced (million tons)<br />
1929 14.5 7.6<br />
1930 11.7 6.2<br />
1931 7.1 3.8<br />
1932 6.5 3.6<br />
1933 7.4 4.1<br />
1934 10.5 6.0<br />
1935 10.8 6.4<br />
1936 12.8 7.7<br />
1937 14.8 8.5<br />
1938 11.6 6.8<br />
a Plot these data on a scatter graph. [3]<br />
Iron produced (million tons)<br />
9<br />
8<br />
7<br />
6<br />
5<br />
4<br />
3<br />
6 8 10 12 14 16<br />
Coal used (million tons)<br />
b Draw a line of best fit. [1]<br />
c i How much iron would you expect to be produced using 15 million tons of coal [1]<br />
ii Why would it be unwise to use the graph to predict values for 1947 [1]<br />
2 The table shows data about cinemas in 10 towns, all approximately the same size.<br />
Number of screens 16 13 19 12 19 21 18 15 20 16<br />
Weekly admissions<br />
(thousands)<br />
9.5 7.8 11.0 7.3 12.4 12.3 9.8 7.7 11.5 8.5<br />
38 Revision Notes © <strong>Hodder</strong> Education 2011