Exam style questions - Hodder Plus Home
Exam style questions - Hodder Plus Home
Exam style questions - Hodder Plus Home

You also want an ePaper? Increase the reach of your titles
YUMPU automatically turns print PDFs into web optimized ePapers that Google loves.
16 Scatter diagrams and<br />
time series<br />
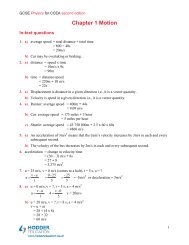
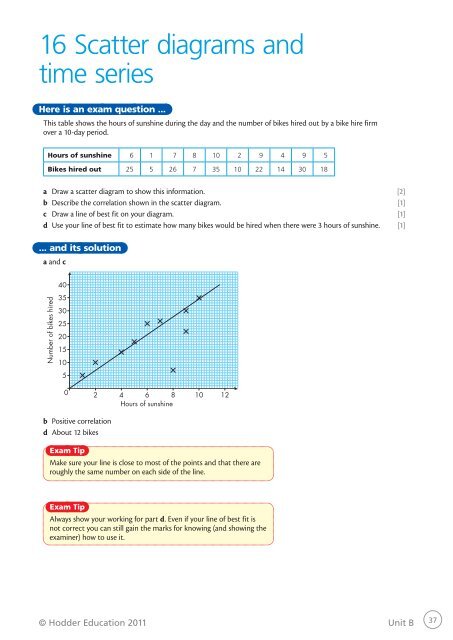
Here is an exam question ...<br />
This table shows the hours of sunshine during the day and the number of bikes hired out by a bike hire firm<br />
over a 10-day period.<br />
Hours of sunshine 6 1 7 8 10 2 9 4 9 5<br />
Bikes hired out 25 5 26 7 35 10 22 14 30 18<br />
a Draw a scatter diagram to show this information. [2]<br />
b Describe the correlation shown in the scatter diagram. [1]<br />
c Draw a line of best fit on your diagram. [1]<br />
d Use your line of best fit to estimate how many bikes would be hired when there were 3 hours of sunshine. [1]<br />
... and its solution<br />
a and c<br />
40<br />
Number of bikes hired<br />
35<br />
30<br />
25<br />
20<br />
15<br />
10<br />
5<br />
0<br />
2 4 6 8 10 12<br />
Hours of sunshine<br />
b Positive correlation<br />
d About 12 bikes<br />
<strong>Exam</strong> Tip<br />
Make sure your line is close to most of the points and that there are<br />
roughly the same number on each side of the line.<br />
<strong>Exam</strong> Tip<br />
Always show your working for part d. Even if your line of best fit is<br />
not correct you can still gain the marks for knowing (and showing the<br />
examiner) how to use it.<br />
© <strong>Hodder</strong> Education 2011 Unit B<br />
37