Exam style questions - Hodder Plus Home
Exam style questions - Hodder Plus Home
Exam style questions - Hodder Plus Home

You also want an ePaper? Increase the reach of your titles
YUMPU automatically turns print PDFs into web optimized ePapers that Google loves.
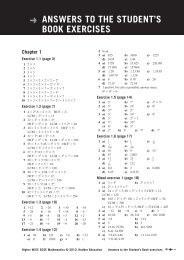
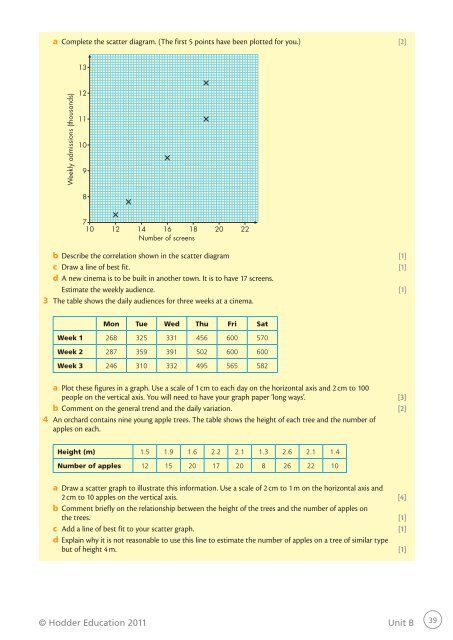
a Complete the scatter diagram. (The first 5 points have been plotted for you.) [2]<br />
13<br />
Weekly admissions (thousands)<br />
12<br />
11<br />
10<br />
9<br />
8<br />
7<br />
10 12 14 16 18 20 22<br />
Number of screens<br />
b Describe the correlation shown in the scatter diagram [1]<br />
c Draw a line of best fit. [1]<br />
d A new cinema is to be built in another town. It is to have 17 screens.<br />
Estimate the weekly audience. [1]<br />
3 The table shows the daily audiences for three weeks at a cinema.<br />
Mon Tue Wed Thu Fri Sat<br />
Week 1 268 325 331 456 600 570<br />
Week 2 287 359 391 502 600 600<br />
Week 3 246 310 332 495 565 582<br />
a Plot these figures in a graph. Use a scale of 1 cm to each day on the horizontal axis and 2 cm to 100<br />
people on the vertical axis. You will need to have your graph paper ‘long ways’. [3]<br />
b Comment on the general trend and the daily variation. [2]<br />
4 An orchard contains nine young apple trees. The table shows the height of each tree and the number of<br />
apples on each.<br />
Height (m) 1.5 1.9 1.6 2.2 2.1 1.3 2.6 2.1 1.4<br />
Number of apples 12 15 20 17 20 8 26 22 10<br />
a Draw a scatter graph to illustrate this information. Use a scale of 2 cm to 1 m on the horizontal axis and<br />
2 cm to 10 apples on the vertical axis. [4]<br />
b Comment briefly on the relationship between the height of the trees and the number of apples on<br />
the trees. [1]<br />
c Add a line of best fit to your scatter graph. [1]<br />
d Explain why it is not reasonable to use this line to estimate the number of apples on a tree of similar type<br />
but of height 4 m. [1]<br />
© <strong>Hodder</strong> Education 2011 Unit B<br />
39