Using IBM SPSS 19 Descriptive Statistics - CBU
Using IBM SPSS 19 Descriptive Statistics - CBU
Using IBM SPSS 19 Descriptive Statistics - CBU

You also want an ePaper? Increase the reach of your titles
YUMPU automatically turns print PDFs into web optimized ePapers that Google loves.
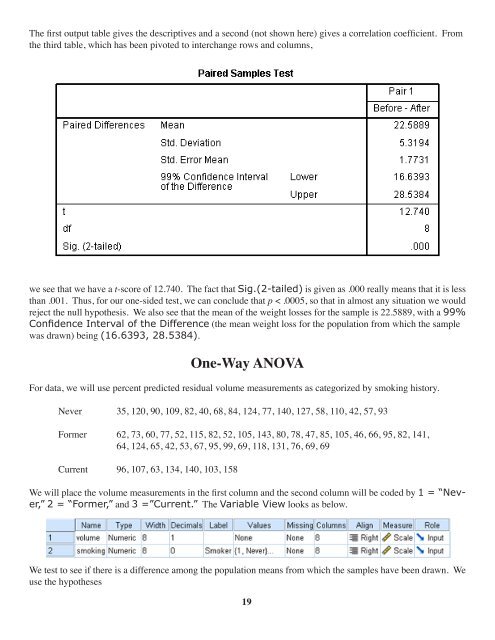
The first output table gives the descriptives and a second (not shown here) gives a correlation coefficient. From<br />
the third table, which has been pivoted to interchange rows and columns,<br />
we see that we have a t-score of 12.740. The fact that Sig.(2-tailed) is given as .000 really means that it is less<br />
than .001. Thus, for our one-sided test, we can conclude that p < .0005, so that in almost any situation we would<br />
reject the null hypothesis. We also see that the mean of the weight losses for the sample is 22.5889, with a 99%<br />
Confidence Interval of the Difference (the mean weight loss for the population from which the sample<br />
was drawn) being (16.6393, 28.5384).<br />
One-Way ANOVA<br />
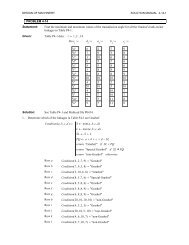
For data, we will use percent predicted residual volume measurements as categorized by smoking history.<br />
Never 35, 120, 90, 109, 82, 40, 68, 84, 124, 77, 140, 127, 58, 110, 42, 57, 93<br />
Former 62, 73, 60, 77, 52, 115, 82, 52, 105, 143, 80, 78, 47, 85, 105, 46, 66, 95, 82, 141,<br />
64, 124, 65, 42, 53, 67, 95, 99, 69, 118, 131, 76, 69, 69<br />
Current 96, 107, 63, 134, 140, 103, 158<br />
We will place the volume measurements in the first column and the second column will be coded by 1 = “Never,”<br />
2 = “Former,” and 3 =”Current.” The Variable View looks as below.<br />
We test to see if there is a difference among the population means from which the samples have been drawn. We<br />
use the hypotheses<br />
<strong>19</strong>