Using IBM SPSS 19 Descriptive Statistics - CBU
Using IBM SPSS 19 Descriptive Statistics - CBU
Using IBM SPSS 19 Descriptive Statistics - CBU

You also want an ePaper? Increase the reach of your titles
YUMPU automatically turns print PDFs into web optimized ePapers that Google loves.
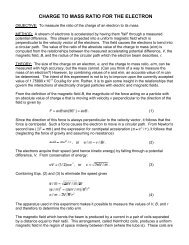
Click Options, and enter 2 for Number of Sigmas. After clicking Continue, since we have specifications<br />
for the mean, we click <strong>Statistics</strong>..., and in the window that opens, based on our specified mean and standard<br />
deviation, enter 50.756 for Upper and 49.244, Lower for Specification Limits, and 50 for Target. Then<br />
select Estimate using S-Bar under Capability Sigma. Finally, click Continue followed by OK to get<br />
the control charts.<br />
The first control chart given as output is the chart for the mean. This chart, which is pretty much self-explanatory,<br />
clearly shows the daily means along with the unspecified (UCL and LCL) and specified (USpec and LSpec)<br />
control limits. It is clear that the process is always in control.<br />
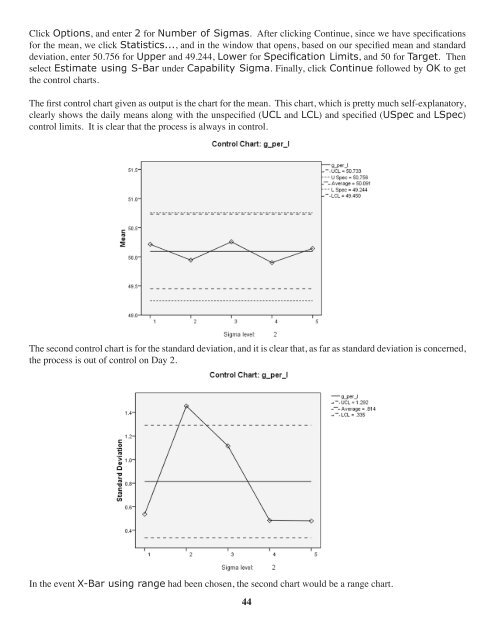
The second control chart is for the standard deviation, and it is clear that, as far as standard deviation is concerned,<br />
the process is out of control on Day 2.<br />
In the event X-Bar using range had been chosen, the second chart would be a range chart.<br />
44