Using IBM SPSS 19 Descriptive Statistics - CBU
Using IBM SPSS 19 Descriptive Statistics - CBU
Using IBM SPSS 19 Descriptive Statistics - CBU

You also want an ePaper? Increase the reach of your titles
YUMPU automatically turns print PDFs into web optimized ePapers that Google loves.
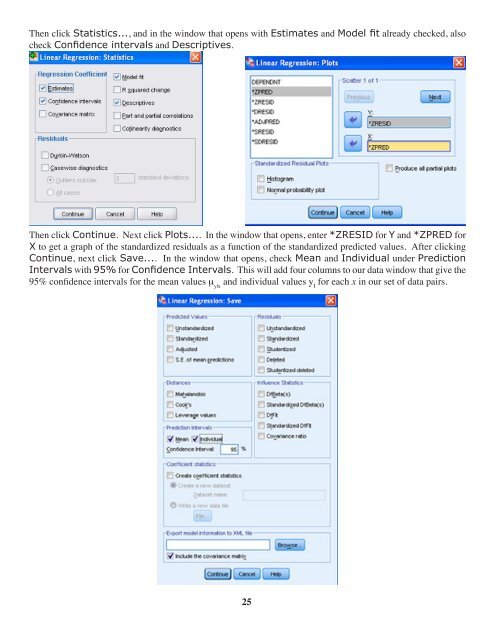
Then click <strong>Statistics</strong>..., and in the window that opens with Estimates and Model fit already checked, also<br />
check Confidence intervals and <strong>Descriptive</strong>s.<br />
Then click Continue. Next click Plots.... In the window that opens, enter *ZRESID for Y and *ZPRED for<br />
X to get a graph of the standardized residuals as a function of the standardized predicted values. After clicking<br />
Continue, next click Save.... In the window that opens, check Mean and Individual under Prediction<br />
Intervals with 95% for Confidence Intervals. This will add four columns to our data window that give the<br />
95% confidence intervals for the mean values m y|x<br />
and individual values y I<br />
for each x in our set of data pairs.<br />
25