Using IBM SPSS 19 Descriptive Statistics - CBU
Using IBM SPSS 19 Descriptive Statistics - CBU
Using IBM SPSS 19 Descriptive Statistics - CBU

You also want an ePaper? Increase the reach of your titles
YUMPU automatically turns print PDFs into web optimized ePapers that Google loves.
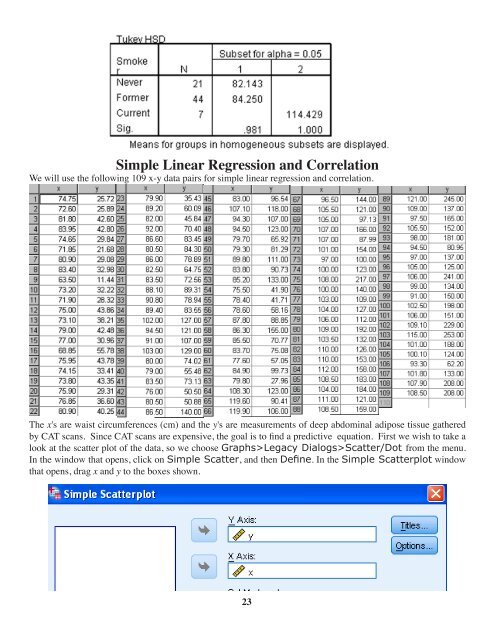
Simple Linear Regression and Correlation<br />
We will use the following 109 x-y data pairs for simple linear regression and correlation.<br />
The x's are waist circumferences (cm) and the y's are measurements of deep abdominal adipose tissue gathered<br />
by CAT scans. Since CAT scans are expensive, the goal is to find a predictive equation. First we wish to take a<br />
look at the scatter plot of the data, so we choose Graphs>Legacy Dialogs>Scatter/Dot from the menu.<br />
In the window that opens, click on Simple Scatter, and then Define. In the Simple Scatterplot window<br />
that opens, drag x and y to the boxes shown.<br />
23