Using IBM SPSS 19 Descriptive Statistics - CBU
Using IBM SPSS 19 Descriptive Statistics - CBU
Using IBM SPSS 19 Descriptive Statistics - CBU

Create successful ePaper yourself
Turn your PDF publications into a flip-book with our unique Google optimized e-Paper software.
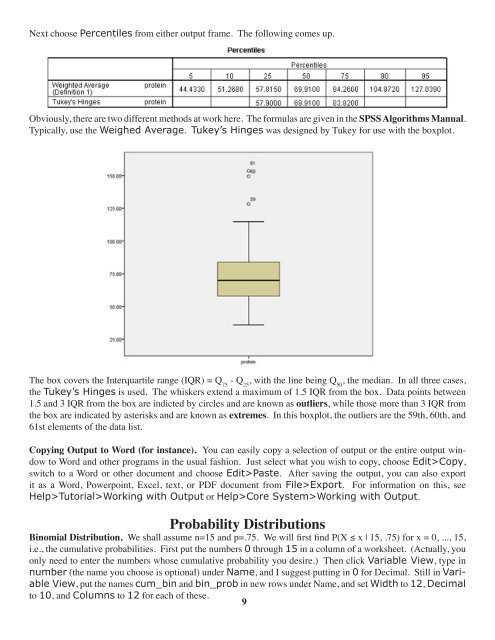
Next choose Percentiles from either output frame. The following comes up.<br />
Obviously, there are two different methods at work here. The formulas are given in the <strong>SPSS</strong> Algorithms Manual.<br />
Typically, use the Weighed Average. Tukey’s Hinges was designed by Tukey for use with the boxplot.<br />
The box covers the Interquartile range (IQR) = Q 75<br />
- Q 25<br />
, with the line being Q 50<br />
, the median. In all three cases,<br />
the Tukey’s Hinges is used. The whiskers extend a maximum of 1.5 IQR from the box. Data points between<br />
1.5 and 3 IQR from the box are indicted by circles and are known as outliers, while those more than 3 IQR from<br />
the box are indicated by asterisks and are known as extremes. In this boxplot, the outliers are the 59th, 60th, and<br />
61st elements of the data list.<br />
Copying Output to Word (for instance). You can easily copy a selection of output or the entire output window<br />
to Word and other programs in the usual fashion. Just select what you wish to copy, choose Edit>Copy,<br />
switch to a Word or other document and choose Edit>Paste. After saving the output, you can also export<br />
it as a Word, Powerpoint, Excel, text, or PDF document from File>Export. For information on this, see<br />
Help>Tutorial>Working with Output or Help>Core System>Working with Output.<br />
Probability Distributions<br />
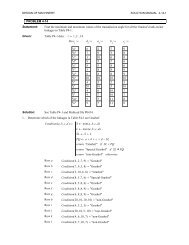
Binomial Distribution. We shall assume n=15 and p=.75. We will first find P(X ≤ x | 15, .75) for x = 0, ..., 15,<br />
i.e., the cumulative probabilities. First put the numbers 0 through 15 in a column of a worksheet. (Actually, you<br />
only need to enter the numbers whose cumulative probability you desire.) Then click Variable View, type in<br />
number (the name you choose is optional) under Name, and I suggest putting in 0 for Decimal. Still in Variable<br />
View, put the names cum_bin and bin_prob in new rows under Name, and set Width to 12, Decimal<br />
to 10, and Columns to 12 for each of these.<br />
9