

australia's identified mineral resources 2004 - Geoscience Australia
australia's identified mineral resources 2004 - Geoscience Australia
australia's identified mineral resources 2004 - Geoscience Australia

Create successful ePaper yourself
Turn your PDF publications into a flip-book with our unique Google optimized e-Paper software.
AUSTRALIA’S IDENTIFIED MINERAL RESOURCES <strong>2004</strong><br />
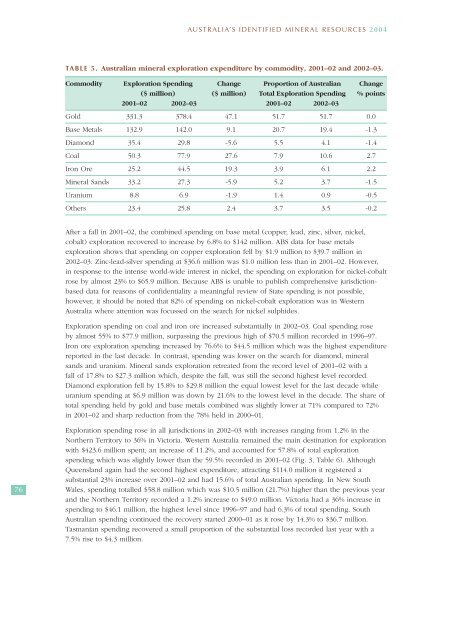
TABLE 5. <strong>Australia</strong>n <strong>mineral</strong> exploration expenditure by commodity, 2001–02 and 2002–03.<br />
Commodity Exploration Spending Change Proportion of <strong>Australia</strong>n Change<br />
($ million) ($ million) Total Exploration Spending % points<br />
2001–02 2002–03 2001–02 2002–03<br />
Gold 331.3 378.4 47.1 51.7 51.7 0.0<br />
Base Metals 132.9 142.0 9.1 20.7 19.4 -1.3<br />
Diamond 35.4 29.8 -5.6 5.5 4.1 -1.4<br />
Coal 50.3 77.9 27.6 7.9 10.6 2.7<br />
Iron Ore 25.2 44.5 19.3 3.9 6.1 2.2<br />
Mineral Sands 33.2 27.3 -5.9 5.2 3.7 -1.5<br />
Uranium 8.8 6.9 -1.9 1.4 0.9 -0.5<br />
Others 23.4 25.8 2.4 3.7 3.5 -0.2<br />
After a fall in 2001–02, the combined spending on base metal (copper, lead, zinc, silver, nickel,<br />
cobalt) exploration recovered to increase by 6.8% to $142 million. ABS data for base metals<br />
exploration shows that spending on copper exploration fell by $1.9 million to $39.7 million in<br />
2002–03. Zinc-lead-silver spending at $36.6 million was $1.0 million less than in 2001–02. However,<br />
in response to the intense world-wide interest in nickel, the spending on exploration for nickel-cobalt<br />
rose by almost 23% to $65.9 million. Because ABS is unable to publish comprehensive jurisdictionbased<br />
data for reasons of confidentiality a meaningful review of State spending is not possible,<br />
however, it should be noted that 82% of spending on nickel-cobalt exploration was in Western<br />
<strong>Australia</strong> where attention was focussed on the search for nickel sulphides.<br />
Exploration spending on coal and iron ore increased substantially in 2002–03. Coal spending rose<br />
by almost 55% to $77.9 million, surpassing the previous high of $70.5 million recorded in 1996–97.<br />
Iron ore exploration spending increased by 76.6% to $44.5 million which was the highest expenditure<br />
reported in the last decade. In contrast, spending was lower on the search for diamond, <strong>mineral</strong><br />
sands and uranium. Mineral sands exploration retreated from the record level of 2001–02 with a<br />
fall of 17.8% to $27.3 million which, despite the fall, was still the second highest level recorded.<br />
Diamond exploration fell by 15.8% to $29.8 million the equal lowest level for the last decade while<br />
uranium spending at $6.9 million was down by 21.6% to the lowest level in the decade. The share of<br />
total spending held by gold and base metals combined was slightly lower at 71% compared to 72%<br />
in 2001–02 and sharp reduction from the 78% held in 2000–01.<br />
76<br />
Exploration spending rose in all jurisdictions in 2002–03 with increases ranging from 1.2% in the<br />
Northern Territory to 36% in Victoria. Western <strong>Australia</strong> remained the main destination for exploration<br />
with $423.6 million spent, an increase of 11.2%, and accounted for 57.8% of total exploration<br />
spending which was slightly lower than the 59.5% recorded in 2001–02 (Fig. 3, Table 6). Although<br />
Queensland again had the second highest expenditure, attracting $114.0 million it registered a<br />
substantial 23% increase over 2001–02 and had 15.6% of total <strong>Australia</strong>n spending. In New South<br />
Wales, spending totalled $58.8 million which was $10.5 million (21.7%) higher than the previous year<br />
and the Northern Territory recorded a 1.2% increase to $49.0 million. Victoria had a 36% increase in<br />
spending to $46.1 million, the highest level since 1996–97 and had 6.3% of total spending. South<br />
<strong>Australia</strong>n spending continued the recovery started 2000–01 as it rose by 14.3% to $36.7 million.<br />
Tasmanian spending recovered a small proportion of the substantial loss recorded last year with a<br />
7.5% rise to $4.3 million.


