Sustainability Report 2009 - The Co-operative
Sustainability Report 2009 - The Co-operative
Sustainability Report 2009 - The Co-operative
Create successful ePaper yourself
Turn your PDF publications into a flip-book with our unique Google optimized e-Paper software.
Ecological sustainability<br />
Climate change<br />
Waste and packaging<br />
Biodiversity<br />
Persistent, bioaccumulative and toxic (PBT) chemicals<br />
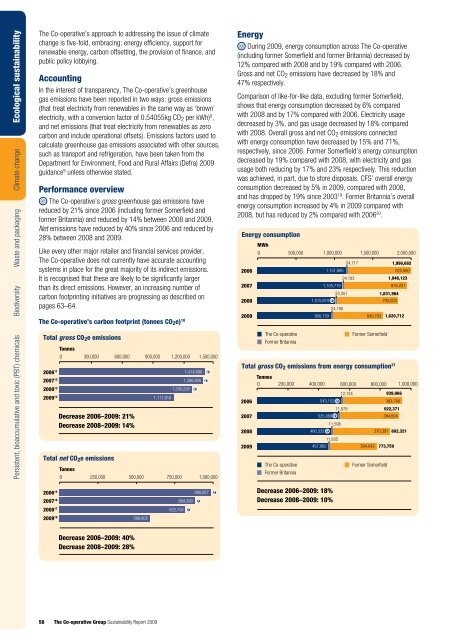
<strong>The</strong> <strong>Co</strong>-<strong>operative</strong>’s approach to addressing the issue of climate<br />
change is five-fold, embracing: energy efficiency, support for<br />
renewable energy, carbon offsetting, the provision of finance, and<br />
public policy lobbying.<br />
Accounting<br />
In the interest of transparency, <strong>The</strong> <strong>Co</strong>-<strong>operative</strong>’s greenhouse<br />
gas emissions have been reported in two ways: gross emissions<br />
(that treat electricity from renewables in the same way as ‘brown’<br />
electricity, with a conversion factor of 0.54055kg CO 2 per kWh) 8 ,<br />
and net emissions (that treat electricity from renewables as zero<br />
carbon and include operational offsets). Emissions factors used to<br />
calculate greenhouse gas emissions associated with other sources,<br />
such as transport and refrigeration, have been taken from the<br />
Department for Environment, Food and Rural Affairs (Defra) <strong>2009</strong><br />
guidance 9 unless otherwise stated.<br />
Performance overview<br />
Tonnes<br />
<strong>The</strong> <strong>Co</strong>-<strong>operative</strong>’s gross greenhouse gas emissions have<br />
reduced by 21% since 2006 (including former Somerfield and<br />
former Britannia) and reduced by 14% between 2008 and <strong>2009</strong>.<br />
Net emissions have reduced by 40% since 2006 and reduced<br />
r<br />
by<br />
r<br />
28% between 2008 and <strong>2009</strong>.<br />
Like every other major retailer and financial services provider,<br />
<strong>The</strong> <strong>Co</strong>-<strong>operative</strong> does not currently have accurate accounting<br />
systems<br />
Decrease<br />
in place for<br />
2008–<strong>2009</strong>:<br />
the great majority<br />
28%<br />
of its indirect emissions.<br />
It is recognised that these are likely to be significantly larger<br />
than its direct emissions. However, an increasing number of<br />
0 400000 500000 carbon footprinting 600000initiatives are progressing as described on<br />
pages 63–64.<br />
Food store and distribution centre refrigeration 21 (tonnes)<br />
0 250,000 500,000 750,000 1,000,000 0 50,000 100,000 150,000 200,000 250,000 300,000<br />
energy<br />
Tonnes<br />
consumption increased by 4% in <strong>2009</strong> compared with<br />
2006 15 988,957 r<br />
2008, but 0 has 100,000 reduced 200,000 by 2% compared 300,000 with 400,000 2006 20 500,000 . 600,000<br />
2006<br />
297,043<br />
2007 16 884,289<br />
9,394<br />
2007<br />
294,229<br />
2006 120,163 r<br />
383,780<br />
2008 17 513,337<br />
822,734 Energy consumption 2008<br />
262,434<br />
43,170 r 1,337<br />
<strong>2009</strong> 18 588,802 <strong>2009</strong><br />
190,543<br />
2007<br />
MWh<br />
386,604 431,111<br />
42,940<br />
0<br />
r 1,289<br />
500,000 1,000,000 1,500,000 2,000,000<br />
Decrease 2006–<strong>2009</strong>: 40%<br />
2008<br />
Decrease 2006–<strong>2009</strong>:<br />
24,717 370,391 414,620<br />
36% 1,996,682<br />
2006 35,791 1,434<br />
1,151,885<br />
820,080<br />
Decrease 2008–<strong>2009</strong>: 27%<br />
<strong>2009</strong><br />
233,822 271,04724,183<br />
1,946,123<br />
2007<br />
1,105,719<br />
816,221<br />
23,351<br />
1,831,964<br />
<strong>The</strong> <strong>Co</strong>-<strong>operative</strong><br />
Former Somerfield<br />
2008<br />
1,015,610 r<br />
793,003<br />
Former Britannia<br />
24,190<br />
<strong>2009</strong><br />
950,729<br />
645,793 1,620,712<br />
<strong>The</strong> <strong>Co</strong>-<strong>operative</strong>’s carbon footprint (tonnes CO 2 e) 10<br />
Decrease 2006–<strong>2009</strong>: 47%<br />
Decrease 2008–<strong>2009</strong>: 35%<br />
<strong>The</strong> <strong>Co</strong>-<strong>operative</strong><br />
Former Somerfield<br />
Total gross CO 2 e emissions<br />
Former Britannia<br />
Tonnes<br />
Distribution 35 (tonnes)<br />
0 300,000 600,000 900,000 1,200,000 1,500,000<br />
0<br />
50,000<br />
100,000 150,000 200,000<br />
Total gross CO 2 emissions from energy consumption 21<br />
2006 11<br />
1,414,686 r<br />
2006<br />
153,100 r<br />
Tonnes<br />
2007 12<br />
1,396,926 r<br />
2007<br />
153,547 r<br />
0 200,000 400,000 600,000 800,000 1,000,000<br />
2008 13<br />
1,290,226 r<br />
2008<br />
148,382 r<br />
12,134<br />
939,066<br />
<strong>2009</strong> 14 1,111,918<br />
<strong>2009</strong> 36<br />
132,314<br />
2006<br />
543,152 r<br />
383,780<br />
1500000 2000000<br />
Decrease 2006–<strong>2009</strong>: 21%<br />
Decrease 2008–<strong>2009</strong>: 14%<br />
00000 800000 1000000<br />
Energy<br />
During <strong>2009</strong>, energy consumption across <strong>The</strong> <strong>Co</strong>-<strong>operative</strong><br />
(including former Somerfield and former Britannia) decreased by<br />
12% compared with 2008 and by 19% compared with 2006.<br />
Gross and net CO 2 emissions have decreased by 18% and<br />
47% respectively.<br />
<strong>Co</strong>mparison of like-for-like data, excluding former Somerfield,<br />
shows that energy consumption decreased by 6% compared<br />
with 2008 and by 17% compared with 2006. Electricity usage<br />
decreased by 3%, and gas usage decreased by 18% compared<br />
with 2008. Overall gross and net CO 2 emissions connected<br />
with energy consumption have decreased by 15% and 71%,<br />
respectively, since 2006. Former Somerfield’s energy consumption<br />
decreased by 19% compared with 2008, with electricity and gas<br />
usage both reducing by 17% and 23% respectively. This reduction<br />
was achieved, in part, due to store disposals. CFS’ overall energy<br />
consumption decreased by 5% in <strong>2009</strong>, compared with 2008,<br />
and has dropped by 19% since 2003 19 . Former Britannia’s overall<br />
2007<br />
2008<br />
<strong>2009</strong><br />
Decrease 525,889 2006–<strong>2009</strong>: r 14%<br />
Decrease 2008–<strong>2009</strong>:<br />
11,598<br />
11%<br />
480,332 r<br />
370,391 862,321<br />
Total net CO 2 e emissions<br />
<strong>The</strong> <strong>Co</strong>-<strong>operative</strong><br />
Former Somerfield<br />
Tonnes<br />
Food store and distribution centre refrigeration 21 (tonnes)<br />
Former Britannia<br />
0 250,000 500,000 750,000 1,000,000 0 50,000 100,000 150,000 200,000 250,000 300,000<br />
457,882<br />
11,835<br />
11,878<br />
304,042<br />
922,371<br />
384,604<br />
773,759<br />
2006 15 988,957 r<br />
Decrease 2006 2006–<strong>2009</strong>: 18%<br />
297,043<br />
2007 16 884,289 r<br />
Decrease 2007 2008–<strong>2009</strong>: 10%<br />
294,229<br />
2008 17 Energy usage (gross) 19 (tonnes)<br />
822,734 r<br />
2008<br />
262,434<br />
<strong>2009</strong> 18 0<br />
250,000 500,000 588,802 750,000 1,000,000<br />
<strong>2009</strong><br />
190,543<br />
2006<br />
2007<br />
2008<br />
<strong>2009</strong><br />
Decrease 2006–<strong>2009</strong>: 40%<br />
Decrease 2008–<strong>2009</strong>: 28%<br />
Decrease 2006–<strong>2009</strong>: 18%<br />
Decrease 2008–<strong>2009</strong>: 10%<br />
939,066<br />
922,372<br />
861,670<br />
777,894<br />
2006<br />
2007<br />
2008<br />
<strong>2009</strong><br />
Business Decrease travel 2006–<strong>2009</strong>: 37 (tonnes) 36%<br />
0<br />
10,000<br />
Decrease 2008–<strong>2009</strong>: 27%<br />
17,089<br />
15,302<br />
20,000<br />
25,477<br />
26,778<br />
30,000<br />
Decrease 2006–<strong>2009</strong>: 40%<br />
Decrease 2008–<strong>2009</strong>: 10%<br />
58<br />
<strong>The</strong> Tonnes <strong>Co</strong>-<strong>operative</strong> Group <strong>Sustainability</strong> <strong>Report</strong> <strong>2009</strong><br />
0 300,000 600,000 900,000 1,200,000<br />
1,500,000<br />
Distribution 35 (tonnes)<br />
0<br />
50,000 100,000 150,000 200,000


