Sustainability Report 2009 - The Co-operative
Sustainability Report 2009 - The Co-operative
Sustainability Report 2009 - The Co-operative

You also want an ePaper? Increase the reach of your titles
YUMPU automatically turns print PDFs into web optimized ePapers that Google loves.
Delivering value<br />
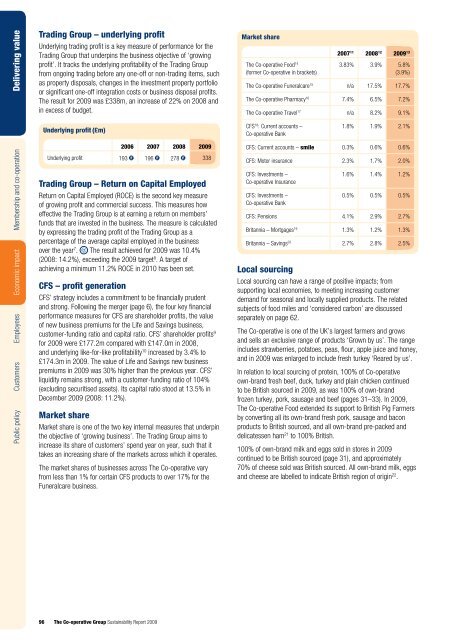
Trading Group – underlying profit<br />
Underlying trading profit is a key measure of performance for the<br />
Trading Group that underpins the business objective of ‘growing<br />
profit’. It tracks the underlying profitability of the Trading Group<br />
from ongoing trading before any one-off or non-trading items, such<br />
as property disposals, changes in the investment property portfolio<br />
or significant one-off integration costs or business disposal profits.<br />
<strong>The</strong> result for <strong>2009</strong> was £338m, an increase of 22% on 2008 and<br />
in excess of budget.<br />
Market share<br />
<strong>The</strong> <strong>Co</strong>-<strong>operative</strong> Food 14<br />
(former <strong>Co</strong>-<strong>operative</strong> in brackets)<br />
2007 11 2008 12 <strong>2009</strong> 13<br />
3.83% 3.9% 5.8%<br />
(3.9%)<br />
<strong>The</strong> <strong>Co</strong>-<strong>operative</strong> Funeralcare 15 n/a 17.5% 17.7%<br />
<strong>The</strong> <strong>Co</strong>-<strong>operative</strong> Pharmacy 16 7.4% 6.5% 7.2%<br />
<strong>The</strong> <strong>Co</strong>-<strong>operative</strong> Travel 17 n/a 8.2% 9.1%<br />
Underlying profit (£m)<br />
CFS 18 : Current accounts –<br />
<strong>Co</strong>-<strong>operative</strong> Bank<br />
1.8% 1.9% 2.1%<br />
Public policy Customers Employees Economic impact Membership and co-operation<br />
2006 2007 2008 <strong>2009</strong><br />
Underlying profit 193 r 196 r 278 r 338<br />
Trading Group – Return on Capital Employed<br />
Return on Capital Employed (ROCE) is the second key measure<br />
of growing profit and commercial success. This measures how<br />
effective the Trading Group is at earning a return on members’<br />
funds that are invested in the business. <strong>The</strong> measure is calculated<br />
by expressing the trading profit of the Trading Group as a<br />
percentage of the average capital employed in the business<br />
over the year 7 . <strong>The</strong> result achieved for <strong>2009</strong> was 10.4%<br />
(2008: 14.2%), exceeding the <strong>2009</strong> target 8 . A target of<br />
achieving a minimum 11.2% ROCE in 2010 has been set.<br />
CFS – profit generation<br />
CFS’ strategy includes a commitment to be financially prudent<br />
and strong. Following the merger (page 6), the four key financial<br />
performance measures for CFS are shareholder profits, the value<br />
of new business premiums for the Life and Savings business,<br />
customer-funding ratio and capital ratio. CFS’ shareholder profits 9<br />
for <strong>2009</strong> were £177.2m compared with £147.0m in 2008,<br />
and underlying like-for-like profitability 10 increased by 3.4% to<br />
£174.3m in <strong>2009</strong>. <strong>The</strong> value of Life and Savings new business<br />
premiums in <strong>2009</strong> was 30% higher than the previous year. CFS’<br />
liquidity remains strong, with a customer-funding ratio of 104%<br />
(excluding securitised assets). Its capital ratio stood at 13.5% in<br />
December <strong>2009</strong> (2008: 11.2%).<br />
Market share<br />
Market share is one of the two key internal measures that underpin<br />
the objective of ‘growing business’. <strong>The</strong> Trading Group aims to<br />
increase its share of customers’ spend year on year, such that it<br />
takes an increasing share of the markets across which it operates.<br />
<strong>The</strong> market shares of businesses across <strong>The</strong> <strong>Co</strong>-<strong>operative</strong> vary<br />
from less than 1% for certain CFS products to over 17% for the<br />
Funeralcare business.<br />
CFS: Current accounts – smile 0.3% 0.6% 0.6%<br />
CFS: Motor insurance 2.3% 1.7% 2.0%<br />
CFS: Investments –<br />
<strong>Co</strong>-<strong>operative</strong> Insurance<br />
CFS: Investments –<br />
<strong>Co</strong>-<strong>operative</strong> Bank<br />
1.6% 1.4% 1.2%<br />
0.5% 0.5% 0.5%<br />
CFS: Pensions 4.1% 2.9% 2.7%<br />
Britannia – Mortgages 19 1.3% 1.2% 1.3%<br />
Britannia – Savings 20 2.7% 2.8% 2.5%<br />
Local sourcing<br />
Local sourcing can have a range of positive impacts; from<br />
supporting local economies, to meeting increasing customer<br />
demand for seasonal and locally supplied products. <strong>The</strong> related<br />
subjects of food miles and ‘considered carbon’ are discussed<br />
separately on page 62.<br />
<strong>The</strong> <strong>Co</strong>-<strong>operative</strong> is one of the UK’s largest farmers and grows<br />
and sells an exclusive range of products ‘Grown by us’. <strong>The</strong> range<br />
includes strawberries, potatoes, peas, flour, apple juice and honey,<br />
and in <strong>2009</strong> was enlarged to include fresh turkey ‘Reared by us’.<br />
In relation to local sourcing of protein, 100% of <strong>Co</strong>-<strong>operative</strong><br />
own-brand fresh beef, duck, turkey and plain chicken continued<br />
to be British sourced in <strong>2009</strong>, as was 100% of own-brand<br />
frozen turkey, pork, sausage and beef (pages 31–33). In <strong>2009</strong>,<br />
<strong>The</strong> <strong>Co</strong>-<strong>operative</strong> Food extended its support to British Pig Farmers<br />
by converting all its own-brand fresh pork, sausage and bacon<br />
products to British sourced, and all own-brand pre-packed and<br />
delicatessen ham 21 to 100% British.<br />
100% of own-brand milk and eggs sold in stores in <strong>2009</strong><br />
continued to be British sourced (page 31), and approximately<br />
70% of cheese sold was British sourced. All own-brand milk, eggs<br />
and cheese are labelled to indicate British region of origin 22 .<br />
96<br />
<strong>The</strong> <strong>Co</strong>-<strong>operative</strong> Group <strong>Sustainability</strong> <strong>Report</strong> <strong>2009</strong>