Sustainability Report 2009 - The Co-operative
Sustainability Report 2009 - The Co-operative
Sustainability Report 2009 - The Co-operative

You also want an ePaper? Increase the reach of your titles
YUMPU automatically turns print PDFs into web optimized ePapers that Google loves.
Decrease 2006–<strong>2009</strong>: 40%<br />
Decrease <strong>The</strong> <strong>Co</strong>-<strong>operative</strong> 2006–<strong>2009</strong>: 36% Former Somerfield<br />
Decrease 2008–<strong>2009</strong>: 28%<br />
Decrease Former Britannia 2008–<strong>2009</strong>: 27%<br />
Tonnes<br />
Food store and distribution centre refrigeration 21 (tonnes)<br />
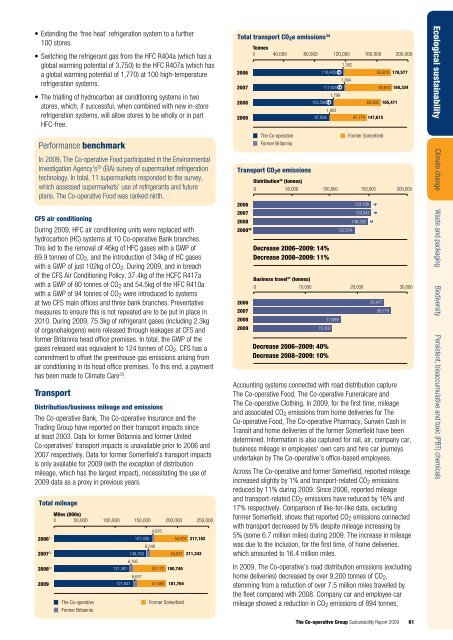
0 • Extending 250,000 the ‘free 500,000 heat’ refrigeration 750,000 system 1,000,000 to a further<br />
Total transport 0 50,000 CO 2 e emissions 100,000 150,000 34 200,000 250,000 300,000<br />
100 stores.<br />
Tonnes<br />
2006 15 988,957 r<br />
2006<br />
297,043<br />
0 40,000 80,000 120,000 160,000 200,000<br />
2007<br />
• Switching the refrigerant gas from the HFC R404a (which has a<br />
884,289 r<br />
2007<br />
294,229<br />
global warming potential of 3,750) to the HFC R407a (which has<br />
1,362<br />
2008 17 822,734 r<br />
2008<br />
262,434<br />
a global warming potential of 1,770) at 100 high-temperature<br />
2006<br />
116,405 r<br />
60,810 178,577<br />
<strong>2009</strong> 18 588,802 <strong>2009</strong><br />
190,543<br />
1,894<br />
refrigeration systems.<br />
2007<br />
117,620 r<br />
60,810 180,324<br />
Tonnes<br />
Distribution<br />
Decrease • <strong>The</strong> 2006–<strong>2009</strong>: trialling of 40% hydrocarbon air conditioning systems in two<br />
Decrease (tonnes)<br />
2006–<strong>2009</strong>: 36% 1,799<br />
0 300,000 600,000 900,000 1,200,000 1,500,000<br />
2008<br />
0<br />
50,000 103,580 100,000 r<br />
150,000 60,092 165,471200,000<br />
Decrease stores, 2008–<strong>2009</strong>: which, if 28% successful, when combined with new in-store<br />
Decrease 2008–<strong>2009</strong>: 27%<br />
1,903<br />
2006 11 refrigeration systems, will allow stores 1,414,686 to be wholly r or in part<br />
<strong>2009</strong> 2006<br />
97,938<br />
47,774<br />
153,100<br />
147,615 r<br />
2007200000 12<br />
HFC-free.<br />
1,396,926 r<br />
250000<br />
2007<br />
153,547 r<br />
2008 13<br />
1,290,226 r<br />
2008<br />
148,382 r<br />
<strong>The</strong> <strong>Co</strong>-<strong>operative</strong><br />
Former Somerfield<br />
<strong>2009</strong> 14 1,111,918<br />
<strong>2009</strong><br />
Performance benchmark<br />
132,314<br />
Former Britannia<br />
Decrease In 2006–<strong>2009</strong>: <strong>2009</strong>, <strong>The</strong> <strong>Co</strong>-<strong>operative</strong> 21% Food participated in the Environmental<br />
Decrease 2006–<strong>2009</strong>: 14%<br />
Decrease Investigation 2008–<strong>2009</strong>: Agency’s 14%<br />
29 (EIA) survey of supermarket refrigeration Transport Decrease CO 2 e 2008–<strong>2009</strong>: emissions 11%<br />
Tonnes<br />
technology. In total, 11 supermarkets responded to the survey,<br />
Distribution 35 (tonnes)<br />
0 which 300,000assessed 600,000 supermarkets’ 900,000 use 1,200,000 of refrigerants 1,500,000 and future<br />
0<br />
50,000<br />
100,000 150,000 200,000<br />
plans. <strong>The</strong> <strong>Co</strong>-<strong>operative</strong> Food was ranked ninth.<br />
2006 11<br />
1,414,686 r<br />
2006<br />
153,100 r<br />
2007 12<br />
1,396,926 r<br />
2007<br />
153,547 r<br />
2008 CFS air conditioning<br />
1,290,226 r<br />
2008<br />
148,382 r<br />
<strong>2009</strong> 14 During <strong>2009</strong>, HFC air conditioning 1,111,918units were replaced with<br />
<strong>2009</strong> 36<br />
132,314<br />
hydrocarbon (HC) systems at 10 <strong>Co</strong>-<strong>operative</strong> Bank branches.<br />
Decrease This 2006–<strong>2009</strong>: led to the removal 21% of 46kg of HFC gases with a GWP of<br />
Energy usage (gross)<br />
Decrease 69.92008–<strong>2009</strong>: tonnes (tonnes)<br />
of CO14%<br />
2 , and the introduction of 34kg of HC gases<br />
0<br />
250,000 500,000 750,000 1,000,000<br />
with a GWP of just 102kg of CO 2 . During <strong>2009</strong>, and in breach<br />
Decrease 2006–<strong>2009</strong>: 14%<br />
Decrease 2008–<strong>2009</strong>: 11%<br />
2006 of the CFS Air <strong>Co</strong>nditioning Policy, 37.4kg 939,066 of the HCFC R417a<br />
Business travel 37 (tonnes)<br />
2007 with a GWP of 80 tonnes of CO 2 and 54.5kg 922,372of the HFC R410a<br />
0<br />
10,000<br />
20,000<br />
30,000<br />
2008 with a GWP of 94 tonnes of CO 2 were 861,670 introduced to systems<br />
<strong>2009</strong> at two CFS main offices and three 777,894 bank branches. Preventative<br />
measures to ensure this is not repeated are to be put in place in<br />
2006<br />
2007<br />
25,477<br />
26,778<br />
Decrease 2006–<strong>2009</strong>: 2010. During 18% <strong>2009</strong>, 75.3kg of refrigerant gases (including 2.3kg<br />
Decrease 2008–<strong>2009</strong>: of organohalogens) 10% were released through leakages at CFS and<br />
2008<br />
<strong>2009</strong><br />
17,089<br />
15,302<br />
Energy usage former (gross) Britannia head office premises. In total, the GWP of the<br />
(tonnes)<br />
gases released was equivalent to 124 tonnes of CO 2 . CFS has a<br />
Decrease 2006–<strong>2009</strong>: 40%<br />
0<br />
250,000 500,000 750,000 1,000,000<br />
commitment to offset the greenhouse gas emissions arising from<br />
Decrease 2008–<strong>2009</strong>: 10%<br />
2006<br />
939,066<br />
air conditioning in its head office premises. To this end, a payment<br />
Business travel 37 (tonnes)<br />
2007<br />
has been made to Climate Care 30 .<br />
922,372<br />
0<br />
10,000<br />
20,000<br />
30,000<br />
2008<br />
861,670<br />
Accounting systems connected with road distribution capture<br />
<strong>2009</strong><br />
777,894<br />
Transport<br />
2006<br />
25,477<br />
<strong>The</strong> <strong>Co</strong>-<strong>operative</strong> Food, <strong>The</strong> <strong>Co</strong>-<strong>operative</strong> Funeralcare and<br />
2007<br />
26,778<br />
<strong>The</strong> <strong>Co</strong>-<strong>operative</strong> Clothing. In <strong>2009</strong>, for the first time, mileage<br />
Energy usage Distribution/business (net) mileage and emissions<br />
Decrease 2006–<strong>2009</strong>: (tonnes)<br />
18%<br />
2008<br />
17,089<br />
0<br />
150,000 300,000 450,000 600,000<br />
and associated CO 2 emissions from home deliveries for <strong>The</strong><br />
<strong>The</strong> <strong>Co</strong>-<strong>operative</strong> Bank, <strong>The</strong> <strong>Co</strong>-<strong>operative</strong> Insurance and the<br />
<strong>2009</strong><br />
15,302<br />
Decrease 2008–<strong>2009</strong>: 10%<br />
<strong>Co</strong>-<strong>operative</strong> Food, <strong>The</strong> <strong>Co</strong>-<strong>operative</strong> Pharmacy, Sunwin Cash in<br />
Trading Group have reported on their transport impacts since<br />
2006<br />
513,337<br />
Transit and home deliveries of the former Somerfield have been<br />
at least 2003. Data for former Britannia and former United<br />
Decrease 2006–<strong>2009</strong>: 40%<br />
2007<br />
429,111<br />
determined. Information is also captured for rail, air, company car,<br />
<strong>Co</strong>-<strong>operative</strong>s’ transport impacts is unavailable prior to 2006 and<br />
Decrease 2008–<strong>2009</strong>: 10%<br />
2008<br />
414,493<br />
business mileage in employees’ own cars and hire car journeys<br />
<strong>2009</strong> 2007 respectively. 271,048 Data for former Somerfield’s transport impacts<br />
undertaken by <strong>The</strong> <strong>Co</strong>-<strong>operative</strong>’s office-based employees.<br />
is only available for <strong>2009</strong> (with the exception of distribution<br />
mileage, which has the largest impact), necessitating the use of Across <strong>The</strong> <strong>Co</strong>-<strong>operative</strong> and former Somerfield, reported mileage<br />
Decrease 2006–<strong>2009</strong>: 47%<br />
<strong>2009</strong> data as a proxy in previous years.<br />
increased slightly by 1% and transport-related CO 2 emissions<br />
Decrease 2008–<strong>2009</strong>: 35%<br />
reduced<br />
Carbon<br />
by 11%<br />
offsets<br />
during<br />
against<br />
<strong>2009</strong>.<br />
operations<br />
Since<br />
(tonnes)<br />
2006, reported mileage<br />
Energy usage (net) 20 (tonnes)<br />
and transport-related 0 CO10,000<br />
2 emissions have reduced 20,000 by 16% and 30,000<br />
0 Total 150,000 mileage 300,000 450,000 600,000<br />
17% respectively. <strong>Co</strong>mparison of like-for-like data, excluding<br />
Miles (000s)<br />
2006<br />
0 50,000 100,000 150,000 513,337 200,000 250,000<br />
former 2007<br />
19,377<br />
Somerfield, shows that reported CO 2 emissions connected<br />
2007<br />
429,111<br />
with<br />
2008<br />
19,791<br />
transport decreased by 5% despite mileage increasing by<br />
4,820<br />
<strong>2009</strong><br />
20,405<br />
2008<br />
5% (some 6.7 million miles) during <strong>2009</strong>. <strong>The</strong> increase in mileage<br />
2006 31<br />
414,493 157,405<br />
54,937 217,162<br />
<strong>2009</strong><br />
271,048<br />
6,546<br />
was due to the inclusion, for the first time, of home deliveries,<br />
2007 32<br />
149,760<br />
54,937 211,243 which amounted to 16.4 million miles.<br />
6,195<br />
Decrease 2006–<strong>2009</strong>: 47%<br />
2008 In <strong>2009</strong>, <strong>The</strong> <strong>Co</strong>-<strong>operative</strong>’s road distribution emissions (excluding<br />
121,381<br />
53,172 180,748<br />
Decrease 2008–<strong>2009</strong>: 35%<br />
6,637<br />
home deliveries) decreased by over 9,200 tonnes of CO 2 ,<br />
<strong>2009</strong><br />
127,647 47,480 181,764<br />
Carbon offsets against operations (tonnes)<br />
stemming from a reduction of over 7.5 million miles travelled by<br />
0<br />
10,000<br />
20,000<br />
30,000<br />
the fleet compared with 2008. <strong>Co</strong>mpany car and employee car<br />
<strong>The</strong> <strong>Co</strong>-<strong>operative</strong><br />
Former Somerfield<br />
mileage 2007 showed a reduction in CO 2 emissions 19,377 of 894 tonnes,<br />
Former Britannia<br />
2008<br />
19,791<br />
<strong>2009</strong><br />
<strong>The</strong> <strong>Co</strong>-<strong>operative</strong> Group 20,405 <strong>Sustainability</strong> <strong>Report</strong> <strong>2009</strong> 61<br />
Ecological sustainability Climate change Waste and packaging Biodiversity Persistent, bioaccumulative and toxic (PBT) chemicals