Sustainability Report 2009 - The Co-operative
Sustainability Report 2009 - The Co-operative
Sustainability Report 2009 - The Co-operative

Create successful ePaper yourself
Turn your PDF publications into a flip-book with our unique Google optimized e-Paper software.
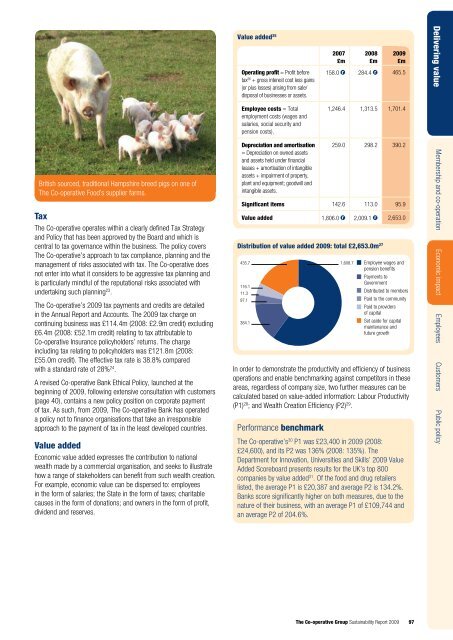
British sourced, traditional Hampshire breed pigs on one of<br />
<strong>The</strong> <strong>Co</strong>-<strong>operative</strong> Food’s supplier farms.<br />
Tax<br />
<strong>The</strong> <strong>Co</strong>-<strong>operative</strong> operates within a clearly defined Tax Strategy<br />
and Policy that has been approved by the Board and which is<br />
central to tax governance within the business. <strong>The</strong> policy covers<br />
<strong>The</strong> <strong>Co</strong>-<strong>operative</strong>’s approach to tax compliance, planning and the<br />
management of risks associated with tax. <strong>The</strong> <strong>Co</strong>-<strong>operative</strong> does<br />
not enter into what it considers to be aggressive tax planning and<br />
is particularly mindful of the reputational risks associated with<br />
undertaking such planning 23 .<br />
<strong>The</strong> <strong>Co</strong>-<strong>operative</strong>’s <strong>2009</strong> tax payments and credits are detailed<br />
in the Annual <strong>Report</strong> and Accounts. <strong>The</strong> <strong>2009</strong> tax charge on<br />
continuing business was £114.4m (2008: £2.9m credit) excluding<br />
£6.4m (2008: £52.1m credit) relating to tax attributable to<br />
<strong>Co</strong>-<strong>operative</strong> Insurance policyholders’ returns. <strong>The</strong> charge<br />
including tax relating to policyholders was £121.8m (2008:<br />
£55.0m credit). <strong>The</strong> effective tax rate is 38.8% compared<br />
with a standard rate of 28% 24 .<br />
A revised <strong>Co</strong>-<strong>operative</strong> Bank Ethical Policy, launched at the<br />
beginning of <strong>2009</strong>, following extensive consultation with customers<br />
(page 40), contains a new policy position on corporate payment<br />
of tax. As such, from <strong>2009</strong>, <strong>The</strong> <strong>Co</strong>-<strong>operative</strong> Bank has operated<br />
a policy not to finance organisations that take an irresponsible<br />
approach to the payment of tax in the least developed countries.<br />
Value added<br />
Economic value added expresses the contribution to national<br />
wealth made by a commercial organisation, and seeks to illustrate<br />
how a range of stakeholders can benefit from such wealth creation.<br />
For example, economic value can be dispersed to: employees<br />
in the form of salaries; the State in the form of taxes; charitable<br />
causes in the form of donations; and owners in the form of profit,<br />
dividend and reserves.<br />
added 25<br />
402<br />
812 Central & Eastern<br />
North<br />
723<br />
North West &<br />
North Midlands<br />
Value<br />
Scotland &<br />
Northern Ireland<br />
739<br />
South East<br />
2007<br />
South<br />
2008<br />
West<br />
<strong>2009</strong><br />
£m £m £m<br />
1,355<br />
Wales<br />
892 Operating profit = Profit before<br />
tax 26 + gross interest cost less gains<br />
(or plus losses) arising from sale/<br />
disposal of businesses or assets.<br />
158.0 r<br />
991<br />
284.4 r 465.5<br />
Employee costs = Total<br />
employment costs (wages and<br />
salaries, social security and<br />
pension costs).<br />
Depreciation and amortisation<br />
= Depreciation on owned assets<br />
and assets held under financial<br />
leases + amortisation of intangible<br />
assets + impairment of property,<br />
plant and equipment; goodwill and<br />
intangible assets.<br />
1,246.4 1,313.5 1,701.4<br />
259.0 298.2 390.2<br />
Significant items 142.6 113.0 95.9<br />
Value added 1,806.0 r 2,009.1 r 2,653.0<br />
Distribution of value added <strong>2009</strong>: total £2,653.0m 27<br />
435.7<br />
116.1<br />
11.3<br />
97.1<br />
384.1<br />
1,608.7<br />
Employee wages and<br />
pension benefits<br />
Payments to<br />
Government<br />
Distributed to members<br />
Paid to the community<br />
Paid to providers<br />
of capital<br />
Set aside for capital<br />
maintenance and<br />
future growth<br />
In order to demonstrate the productivity and efficiency of business<br />
operations and enable benchmarking against competitors in these<br />
areas, regardless of company size, two further measures can be<br />
calculated based on value-added information: Labour Productivity<br />
(P1) 28 ; and Wealth Creation Efficiency (P2) 29 .<br />
Performance benchmark<br />
<strong>The</strong> <strong>Co</strong>-<strong>operative</strong>’s 30 P1 was £23,400 in <strong>2009</strong> (2008:<br />
£24,600), and its P2 was 136% (2008: 135%). <strong>The</strong><br />
Department for Innovation, Universities and Skills’ <strong>2009</strong> Value<br />
Added Scoreboard presents results for the UK’s top 800<br />
companies by value added 31 . Of the food and drug retailers<br />
listed, the average P1 is £20,387 and average P2 is 134.2%.<br />
Banks score significantly higher on both measures, due to the<br />
nature of their business, with an average P1 of £109,744 and<br />
an average P2 of 204.6%.<br />
Delivering value Membership and co-operation Economic impact Employees Customers Public policy<br />
<strong>The</strong> <strong>Co</strong>-<strong>operative</strong> Group <strong>Sustainability</strong> <strong>Report</strong> <strong>2009</strong> 97