Use of oxytocin and misoprostol for induction or ... - POPPHI
Use of oxytocin and misoprostol for induction or ... - POPPHI
Use of oxytocin and misoprostol for induction or ... - POPPHI

You also want an ePaper? Increase the reach of your titles
YUMPU automatically turns print PDFs into web optimized ePapers that Google loves.
variable <strong>induction</strong> rates in Washington State, showed the lowest rates in public, federally<br />
owned hospitals <strong>and</strong> higher rates in private hospitals (OR 3.9; 1.8-8.6) <strong>and</strong> very high<br />
volume city hospitals (OR 4.2; 2.4-7.2) (70). In New Y<strong>or</strong>k State, the variation in<br />
<strong>induction</strong> rates was explained by differences in individual provider practice styles, a lack<br />
<strong>of</strong> st<strong>and</strong>ardization <strong>of</strong> methods <strong>and</strong> lack <strong>of</strong> evidence-based practice (66, 71). Differences<br />
in rates <strong>of</strong> <strong>induction</strong> have also been attributed to maternal parity <strong>and</strong> age (72).<br />
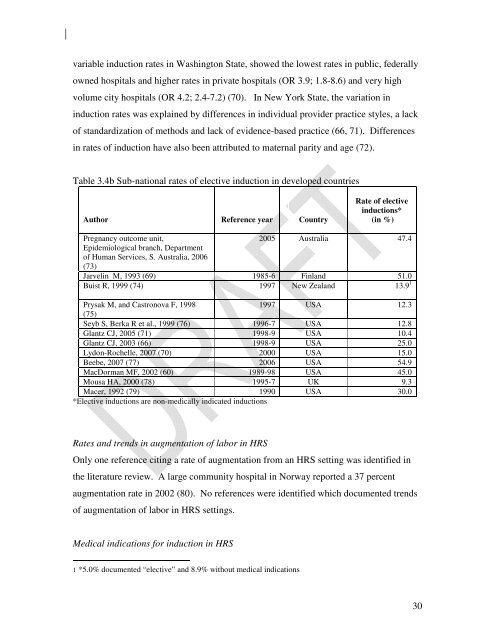
Table 3.4b Sub-national rates <strong>of</strong> elective <strong>induction</strong> in developed countries<br />
Auth<strong>or</strong> Reference year Country<br />
Rate <strong>of</strong> elective<br />
<strong>induction</strong>s*<br />
(in %)<br />
Pregnancy outcome unit,<br />
2005 Australia 47.4<br />
Epidemiological branch, Department<br />
<strong>of</strong> Human Services, S. Australia, 2006<br />
(73)<br />
Jarvelin M, 1993 (69) 1985-6 Finl<strong>and</strong> 51.0<br />
Buist R, 1999 (74) 1997 New Zeal<strong>and</strong> 13.9 1<br />
Prysak M, <strong>and</strong> Castronova F, 1998<br />
1997 USA 12.3<br />
(75)<br />
Seyb S, Berka R et al., 1999 (76) 1996-7 USA 12.8<br />
Glantz CJ, 2005 (71) 1998-9 USA 10.4<br />
Glantz CJ, 2003 (66) 1998-9 USA 25.0<br />
Lydon-Rochelle, 2007 (70) 2000 USA 15.0<br />
Beebe, 2007 (77) 2006 USA 54.9<br />
MacD<strong>or</strong>man MF, 2002 (60) 1989-98 USA 45.0<br />
Mousa HA, 2000 (78) 1995-7 UK 9.3<br />
Macer, 1992 (79) 1990 USA 30.0<br />
*Elective <strong>induction</strong>s are non-medically indicated <strong>induction</strong>s<br />
Rates <strong>and</strong> trends in augmentation <strong>of</strong> lab<strong>or</strong> in HRS<br />
Only one reference citing a rate <strong>of</strong> augmentation from an HRS setting was identified in<br />
the literature review. A large community hospital in N<strong>or</strong>way rep<strong>or</strong>ted a 37 percent<br />
augmentation rate in 2002 (80). No references were identified which documented trends<br />
<strong>of</strong> augmentation <strong>of</strong> lab<strong>or</strong> in HRS settings.<br />
Medical indications <strong>f<strong>or</strong></strong> <strong>induction</strong> in HRS<br />
1 *5.0% documented “elective” <strong>and</strong> 8.9% without medical indications<br />
30