Use of oxytocin and misoprostol for induction or ... - POPPHI
Use of oxytocin and misoprostol for induction or ... - POPPHI
Use of oxytocin and misoprostol for induction or ... - POPPHI

Create successful ePaper yourself
Turn your PDF publications into a flip-book with our unique Google optimized e-Paper software.
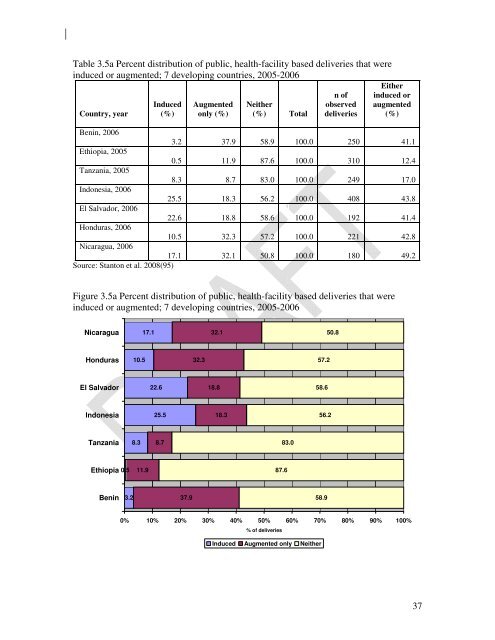
Table 3.5a Percent distribution <strong>of</strong> public, health-facility based deliveries that were<br />
induced <strong>or</strong> augmented; 7 developing countries, 2005-2006<br />
Country, year<br />
Induced<br />
(%)<br />
Augmented<br />
only (%)<br />
Neither<br />
(%) Total<br />
n <strong>of</strong><br />
observed<br />
deliveries<br />
Either<br />
induced <strong>or</strong><br />
augmented<br />
(%)<br />
Benin, 2006<br />
3.2 37.9 58.9 100.0 250 41.1<br />
Ethiopia, 2005<br />
0.5 11.9 87.6 100.0 310 12.4<br />
Tanzania, 2005<br />
8.3 8.7 83.0 100.0 249 17.0<br />
Indonesia, 2006<br />
25.5 18.3 56.2 100.0 408 43.8<br />
El Salvad<strong>or</strong>, 2006<br />
22.6 18.8 58.6 100.0 192 41.4<br />
Honduras, 2006<br />
10.5 32.3 57.2 100.0 221 42.8<br />
Nicaragua, 2006<br />
17.1 32.1 50.8 100.0 180 49.2<br />
Source: Stanton et al. 2008(95)<br />
Figure 3.5a Percent distribution <strong>of</strong> public, health-facility based deliveries that were<br />
induced <strong>or</strong> augmented; 7 developing countries, 2005-2006<br />
Nicaragua<br />
17.1<br />
32.1<br />
50.8<br />
Honduras<br />
10.5<br />
32.3<br />
57.2<br />
El Salvad<strong>or</strong><br />
22.6<br />
18.8<br />
58.6<br />
Indonesia<br />
25.5<br />
18.3<br />
56.2<br />
Tanzania<br />
8.3<br />
8.7<br />
83.0<br />
Ethiopia 0.5<br />
11.9<br />
87.6<br />
Benin<br />
3.2<br />
37.9<br />
58.9<br />
0% 10% 20% 30% 40% 50% 60% 70% 80% 90% 100%<br />
% <strong>of</strong> deliveries<br />
Induced Augmented only Neither<br />
37