hse group
hse group
hse group

Create successful ePaper yourself
Turn your PDF publications into a flip-book with our unique Google optimized e-Paper software.
2.15 compared to 2001 when was set at<br />
2.87. Both in 2002 as well as in 2001 the<br />
value has been above 1, which means<br />
that the company is using long-term financing<br />
not only for inventories but also<br />
other short-term assets.<br />
Current Ratio<br />
The current ratio displays the level of<br />
financing the company’s short-term assets<br />
by using short-term liabilities. The<br />
current ratio has dropped in 2002 to<br />
2.18 but it still displays that the company’s<br />
solvency is at a high level.<br />
Accounts Receivable to Accounts<br />
Payable Ratio<br />
The HSE accounts receivable to accounts<br />
payable ratio shows us that the company’s<br />
accounts receivable substantially outweigh<br />
its accounts payable. The value of<br />
this ratio for the financial year 2002 is 6.61.<br />
Fixed Operating Assets Turnover Ratio<br />
The company’s fixed operating assets<br />
turnover ratio for 2002 is set at 0.04. The<br />
low value of this ratio shows us that the<br />
turnover period for fixed assets is long<br />
and that the company’s fixed assets are<br />
depreciated over an average period of 25<br />
years. Regarding the fact that a majority<br />
of the company’s fixed assets are still to<br />
be activated (they are still under construction<br />
or in process and are not yet<br />
being depreciated) this is understandable.<br />
Operating Effectiveness Ratio<br />
The operating effectiveness ratio is<br />
above 1, which means that the company’s<br />
operating revenues exceed the company’s<br />
operating expenses. This shows<br />
that the company is displaying an operating<br />
profit. The value of this ratio has<br />
been reduced from 3.40 in 2001 to 1.16<br />
in 2002. Regarding the volume of operations<br />
generated during each year the figures<br />
are not comparable.<br />
Overall Effectiveness Ratio<br />
The value of the overall effectiveness ratio<br />
of 1.15 means that in 2002 HSE managed<br />
to achieve total revenues in the amount of<br />
SIT 115 per SIT 100 of total expenses.<br />
Operating Revenue Profitability<br />
The operating revenue profitability<br />
shows us that the company generated<br />
an operating profit of SIT 13.92 per SIT<br />
100 of operating revenues.<br />
Total Revenue Net Profitability<br />
The total revenue net profitability ratio is<br />
set at 13.37 percent; this shows us that<br />
the company generated a net profit of SIT<br />
13.37 per SIT 100 of total revenues.<br />
Added Value<br />
The added value for 2002 amounted to<br />
SIT 13,353,741,000, which is a substantial<br />
rise compared to SIT 62,527,000 generated<br />
in 2001.<br />
Net Return on Capital<br />
The net return on capital coefficient<br />
shows us that the company managed<br />
to generate a net profit of SIT 7 per SIT<br />
100 of invested capital. Regarding the<br />
fact that HSE is a capital-intensive company<br />
the value is quite reasonable.<br />
Operating revenues net inflow ratio<br />
The operating revenues net inflow ratio<br />
is calculated as the relation between<br />
the surpluses of inflows from operating<br />
activity over operating revenues. The<br />
ratio of 11.61% shows us that the company<br />
generated an excess of SIT 11.61<br />
of inflows from operating activity per<br />
SIT 100 of operating revenues.<br />
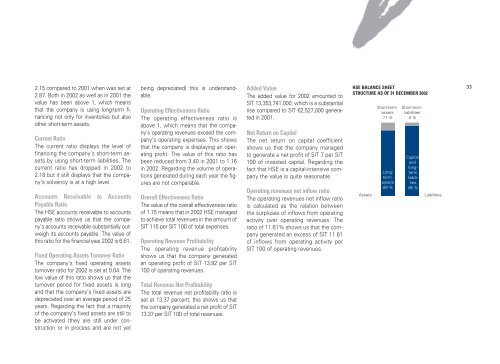
HSE BALANCE SHEET<br />
STRUCTURE AS OF 31 DECEMBER 2002<br />
Assets<br />
Short-term<br />
assets<br />
11 %<br />
Longterm<br />
assets<br />
89 %<br />
Short-term<br />
liabilities<br />
5 %<br />
Capital<br />
and<br />
longterm<br />
liabilities<br />
95 %<br />
Liabilities<br />
33