hse group
hse group
hse group

Create successful ePaper yourself
Turn your PDF publications into a flip-book with our unique Google optimized e-Paper software.
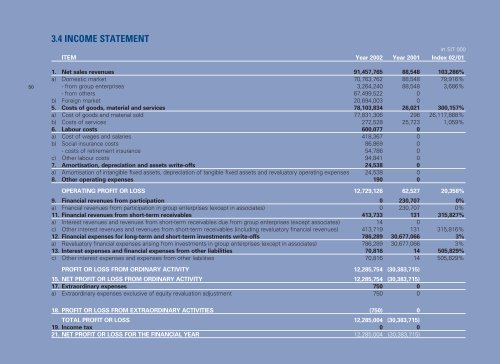
3.4 INCOME STATEMENT<br />
in SIT 000<br />
ITEM Year 2002 Year 2001 Index 02/01<br />
50<br />
1. Net sales revenues 91,457,765 88,548 103,286%<br />
a) Domestic market 70,763,762 88,548 79,916%<br />
- from <strong>group</strong> enterprises 3,264,240 88,548 3,686%<br />
- from others 67,499,522 0<br />
b) Foreign market 20,694,003 0<br />
5. Costs of goods, material and services 78,103,834 26,021 300,157%<br />
a) Cost of goods and material sold 77,831,306 298 26,117,888%<br />
b) Costs of services 272,528 25,723 1,059%<br />
6. Labour costs 600,077 0<br />
a) Cost of wages and salaries 418,367 0<br />
b) Social insurance costs 86,869 0<br />
- costs of retirement insurance 54,786 0<br />
c) Other labour costs 94,841 0<br />
7. Amortisation, depreciation and assets write-offs 24,538 0<br />
a) Amortisation of intangible fixed assets, depreciation of tangible fixed assets and revaluatory operating expenses 24,538 0<br />
8. Other operating expenses 190 0<br />
OPERATING PROFIT OR LOSS 12,729,126 62,527 20,358%<br />
9. Financial revenues from participation 0 230,707 0%<br />
a) Fnancial revenues from participation in <strong>group</strong> enterprises (except in associates) 0 230,707 0%<br />
11. Financial revenues from short-term receivables 413,733 131 315,827%<br />
a) Interest revenues and revenues from short-term receivables due from <strong>group</strong> enterprises (except associates) 14 0<br />
c) Other interest revenues and revenues from short-term receivables (including revaluatory financial revenues) 413,719 131 315,816%<br />
12. Financial expenses for long-term and short-term investments write-offs 786,289 30,677,066 3%<br />
a) Revaluatory financial expenses arising from investments in <strong>group</strong> enterprises (except in associates) 786,289 30,677,066 3%<br />
13. Interest expenses and financial expenses from other liabilities 70,816 14 505,829%<br />
c) Other interest expenses and expenses from other liabilities 70,816 14 505,829%<br />
PROFIT OR LOSS FROM ORDINARY ACTIVITY 12,285,754 (30,383,715)<br />
15. NET PROFIT OR LOSS FROM ORDINARY ACTIVITY 12,285,754 (30,383,715)<br />
17. Extraordinary expenses 750 0<br />
a) Extraordinary expenses exclusive of equity revaluation adjustment 750 0<br />
18. PROFIT OR LOSS FROM EXTRAORDINARY ACTIVITIES (750) 0<br />
TOTAL PROFIT OR LOSS 12,285,004 (30,383,715)<br />
19. Income tax 0 0<br />
21. NET PROFIT OR LOSS FOR THE FINANCIAL YEAR 12,285,004 (30,383,715)