Copeland Health Profile 2010 - Cumbria County Council
Copeland Health Profile 2010 - Cumbria County Council
Copeland Health Profile 2010 - Cumbria County Council

You also want an ePaper? Increase the reach of your titles
YUMPU automatically turns print PDFs into web optimized ePapers that Google loves.
during 2008 to one death. Infant mortality is mainly as a result of: immaturity, low birth<br />
weight, sudden unexpected death in infancy, congenital malformations and infection.<br />
The emphasis on reducing smoking during pregnancy, teenage pregnancy obesity, improved<br />
parental nutrition and an increase in breast feeding contribute to reducing the number of<br />
deaths in the first year of life.<br />
Mortality during 2009<br />
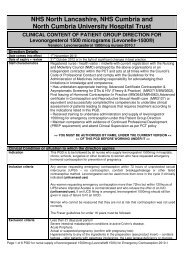
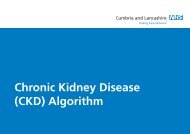
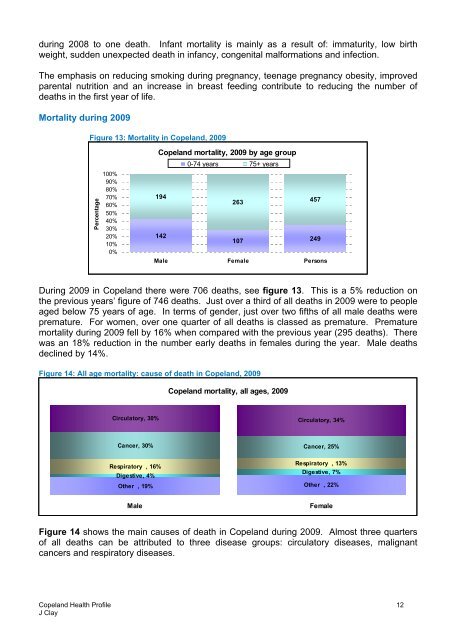
Figure 13: Mortality in <strong>Copeland</strong>, 2009<br />
<strong>Copeland</strong> mortality, 2009 by age group<br />
Percentage<br />
100%<br />
90%<br />
80%<br />
70%<br />
60%<br />
50%<br />
40%<br />
30%<br />
20%<br />
10%<br />
0%<br />
0-74 years 75+ years<br />
194<br />
263<br />
457<br />
142<br />
107 249<br />
Male Female Persons<br />
During 2009 in <strong>Copeland</strong> there were 706 deaths, see figure 13. This is a 5% reduction on<br />
the previous years’ figure of 746 deaths. Just over a third of all deaths in 2009 were to people<br />
aged below 75 years of age. In terms of gender, just over two fifths of all male deaths were<br />
premature. For women, over one quarter of all deaths is classed as premature. Premature<br />
mortality during 2009 fell by 16% when compared with the previous year (295 deaths). There<br />
was an 18% reduction in the number early deaths in females during the year. Male deaths<br />
declined by 14%.<br />
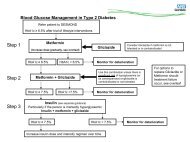
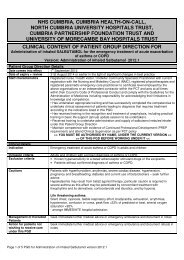
Figure 14: All age mortality: cause of death in <strong>Copeland</strong>, 2009<br />
<strong>Copeland</strong> mortality, all ages, 2009<br />
Circulatory, 30% Circulatory, 34%<br />
Cancer, 30% Cancer, 25%<br />
Respiratory , 13%<br />
Respiratory , 16%<br />
Digestive, 7%<br />
Digestive, 4%<br />
Other , 19% Other , 22%<br />
Male<br />
Female<br />
Figure 14 shows the main causes of death in <strong>Copeland</strong> during 2009. Almost three quarters<br />
of all deaths can be attributed to three disease groups: circulatory diseases, malignant<br />
cancers and respiratory diseases.<br />
<strong>Copeland</strong> <strong>Health</strong> <strong>Profile</strong><br />
J Clay<br />
12