Copeland Health Profile 2010 - Cumbria County Council
Copeland Health Profile 2010 - Cumbria County Council
Copeland Health Profile 2010 - Cumbria County Council

You also want an ePaper? Increase the reach of your titles
YUMPU automatically turns print PDFs into web optimized ePapers that Google loves.
Premature deaths from cancer<br />
The risk of developing cancer depends on many factors: including age, lifestyle and genetic<br />
make-up. It is estimated that up to half of all cancers could be avoided if people made<br />
changes to their lifestyles such as stopping smoking, moderate alcohol intake, maintaining a<br />
healthy bodyweight and avoiding excessive sun exposure. Early detection and increased<br />
awareness of screening interventions such as colorectal, breast and cervical screening<br />
provide an opportunity to reduce premature mortality rates.<br />
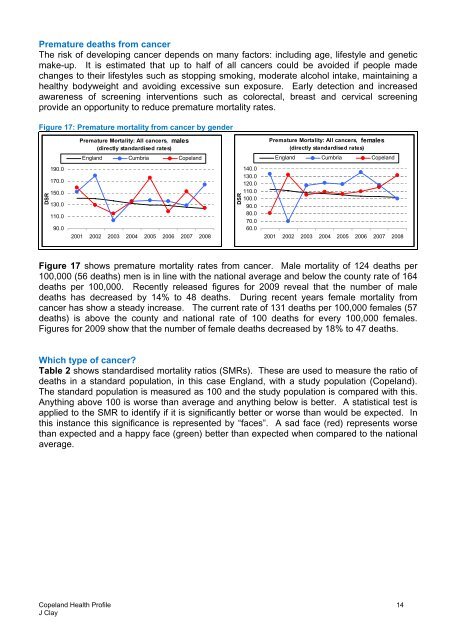
Figure 17: Premature mortality from cancer by gender<br />
Premature Mortality: All cancers, males<br />
(directly standardised rates)<br />
Premature Mortality: All cancers, females<br />
(directly standardised rates)<br />
England <strong>Cumbria</strong> <strong>Copeland</strong><br />
England <strong>Cumbria</strong> <strong>Copeland</strong><br />
DSR<br />
190.0<br />
170.0<br />
150.0<br />
130.0<br />
110.0<br />
90.0<br />
2001 2002 2003 2004 2005 2006 2007 2008<br />
DSR<br />
140.0<br />
130.0<br />
120.0<br />
110.0<br />
100.0<br />
90.0<br />
80.0<br />
70.0<br />
60.0<br />
2001 2002 2003 2004 2005 2006 2007 2008<br />
Figure 17 shows premature mortality rates from cancer. Male mortality of 124 deaths per<br />
100,000 (56 deaths) men is in line with the national average and below the county rate of 164<br />
deaths per 100,000. Recently released figures for 2009 reveal that the number of male<br />
deaths has decreased by 14% to 48 deaths. During recent years female mortality from<br />
cancer has show a steady increase. The current rate of 131 deaths per 100,000 females (57<br />
deaths) is above the county and national rate of 100 deaths for every 100,000 females.<br />
Figures for 2009 show that the number of female deaths decreased by 18% to 47 deaths.<br />
Which type of cancer<br />
Table 2 shows standardised mortality ratios (SMRs). These are used to measure the ratio of<br />
deaths in a standard population, in this case England, with a study population (<strong>Copeland</strong>).<br />
The standard population is measured as 100 and the study population is compared with this.<br />
Anything above 100 is worse than average and anything below is better. A statistical test is<br />
applied to the SMR to identify if it is significantly better or worse than would be expected. In<br />
this instance this significance is represented by “faces”. A sad face (red) represents worse<br />
than expected and a happy face (green) better than expected when compared to the national<br />
average.<br />
<strong>Copeland</strong> <strong>Health</strong> <strong>Profile</strong><br />
J Clay<br />
14