Copeland Health Profile 2010 - Cumbria County Council
Copeland Health Profile 2010 - Cumbria County Council
Copeland Health Profile 2010 - Cumbria County Council

You also want an ePaper? Increase the reach of your titles
YUMPU automatically turns print PDFs into web optimized ePapers that Google loves.
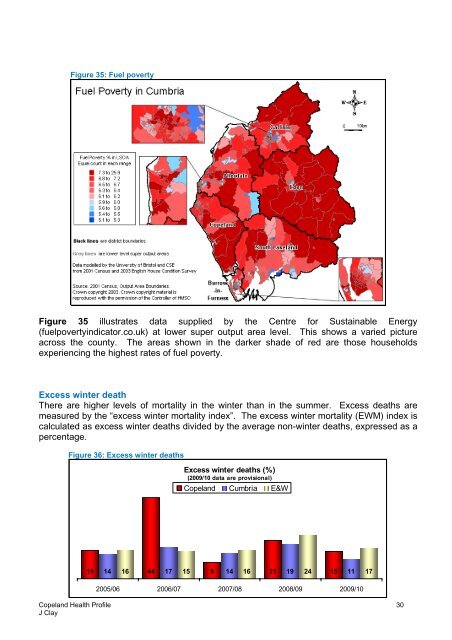
Figure 35: Fuel poverty<br />
Figure 35 illustrates data supplied by the Centre for Sustainable Energy<br />
(fuelpovertyindicator.co.uk) at lower super output area level. This shows a varied picture<br />
across the county. The areas shown in the darker shade of red are those households<br />
experiencing the highest rates of fuel poverty.<br />
Excess winter death<br />
There are higher levels of mortality in the winter than in the summer. Excess deaths are<br />
measured by the “excess winter mortality index”. The excess winter mortality (EWM) index is<br />
calculated as excess winter deaths divided by the average non-winter deaths, expressed as a<br />
percentage.<br />
Figure 36: Excess winter deaths<br />
Excess winter deaths (%)<br />
(2009/10 data are provisional)<br />
<strong>Copeland</strong> <strong>Cumbria</strong> E&W<br />
15 14 16 44 17 15 9 14 16 21 19 24 15 11 17<br />
2005/06 2006/07 2007/08 2008/09 2009/10<br />
<strong>Copeland</strong> <strong>Health</strong> <strong>Profile</strong><br />
J Clay<br />
30