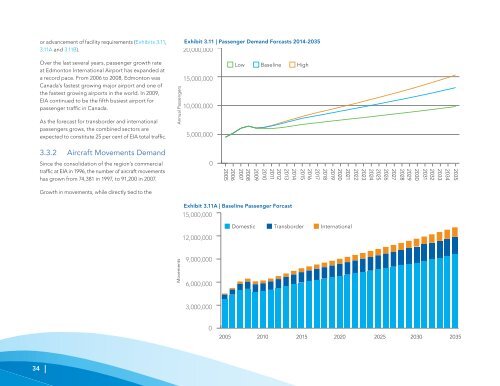
or advancement of facility requirements (Exhibits 3.11, 3.11A and 3.11B). Exhibit 3.11 | Passenger Demand Forcasts 2014-2035 20,000,000 Over the last several years, passenger growth rate at <strong>Edmonton</strong> <strong>International</strong> <strong>Airport</strong> has expanded at a record pace. From 2006 to 2008, <strong>Edmonton</strong> was Canada’s fastest growing major airport and one of the fastest growing airports in the world. In 2009, <strong>EIA</strong> continued to be the fifth busiest airport for passenger traffic in Canada. As the forecast for transborder and international passengers grows, the combined sectors are expected to constitute 25 per cent of <strong>EIA</strong> total traffic. Annual Passengers 15,000,000 10,000,000 5,000,000 Low Baseline High 3.3.2 Aircraft Movements Demand Since the consolidation of the region’s commercial traffic at <strong>EIA</strong> in 1996, the number of aircraft movements has grown from 74,381 in 1997, to 91,200 in 2007. Growth in movements, while directly tied to the 0 2006 2005 2008 2007 2009 2014 2013 2012 2011 2010 2020 2019 2018 2017 2016 2015 2021 2027 2026 2025 2024 2023 2022 2030 2029 2028 2034 2033 2032 2031 2035 Exhibit 3.11A | Baseline Passenger Forcast 15,000,000 Domestic Transborder <strong>International</strong> 12,000,000 Movements 9,000,000 6,000,000 3,000,000 0 2005 2010 2015 2020 2025 2030 2035 34
Exhibit 3.11B | Baseline Passenger Forecast Year Domestic Transborder <strong>International</strong> Total 2005 3,772,952 594,803 143,726 4,511,481 2006 4,349,081 693,378 171,533 5,213,992 2007 4,936,592 810,318 317,700 6,064,610 2008 5,106,860 943,911 386,563 6,437,334 2009 4,704,189 1,003,437 382,587 6,090,213 2010 4,785,276 1,057,054 361,036 6,203,366 2011 4,980,560 1,103,207 367,736 6,451,503 2012 5,216,040 1,165,141 392,897 6,774,078 2013 5,441,278 1,230,511 440,992 7,112,781 2014 5,683,824 1,297,030 473,341 7,454,195 2015 5,920,123 1,363,186 506,326 7,789,635 2016 6,089,916 1,407,970 535,035 8,032,922 2017 6,260,738 1,451,662 563,744 8,276,145 2018 6,430,532 1,496,446 592,454 8,519,431 2019 6,602,383 1,544,507 625,513 8,772,403 2020 6,774,234 1,592,568 657,702 9,024,504 2021 6,946,086 1,639,537 690,761 9,276,383 2022 7,116,908 1,687,598 723,820 9,528,326 2023 7,288,759 1,735,659 756,009 9,780,427 2024 7,463,698 1,784,812 793,418 10,041,928 2025 7,637,607 1,833,966 830,827 10,302,400 2026 7,812,545 1,884,211 868,236 10,564,993 2027 7,986,455 1,933,365 905,645 10,825,465 2028 8,161,393 1,982,518 943,054 11,086,965 2029 8,340,164 2,032,921 982,008 11,355,093 2030 8,522,850 2,084,606 1,022,571 11,630,027 2031 8,709,538 2,137,604 1,064,810 11,911,952 2032 8,900,315 2,191,950 1,108,794 12,201,058 2033 9,095,271 2,247,677 1,154,594 12,497,542 Movements growth in passenger traffic, is also affected by aircraft mix and air carrier strategies. The introduction of regional jets has allowed air carriers to serve some long and thin routes with increased frequency while reducing average aircraft size at the airport. Forecasts of air carrier movements by sectors are shown in Exhibit 3.12 for the Base Case scenario. As Canada’s jobless rates recover from the 2008- 2009 global economic downturn, passenger aircraft movements are expected to grow from 93,300 in 2009, to 187,000 in 2035, a growth of approximately two per cent per year. The growth in transborder and international sectors is expected to be higher than the dominant domestic sector traffic. Air cargo and business aviation traffic is forecast to grow at 1.7 per cent and 4.5 per cent per year respectively, over the next 26 years. Exhibit 3.12 | Passenger Air Carrier Movements by Sectors 200,000 150,000 100,000 50,000 Domestic Transborder <strong>International</strong> Air cargo movements are comprised of 40 per cent narrow-body jet aircraft and 60 per cent of turbo prop aircraft. By 2035, the number of air cargo jet movements is expected to increase to 3.5 per cent of traffic as a result of focused air cargo development initiatives in the region. Business aviation traffic is expected to increase as a percentage of total activity over the next 25 years starting in 2014. The future closure of <strong>Edmonton</strong> City Centre <strong>Airport</strong> is projected to add between 15,000 and 50,000 turboprop and jet movements. The number of movements that will transfer to <strong>EIA</strong> with ECCA’s closure and the resultant economic growth is uncertain at this time. However, to monitor the need for additional facilities in response to the potential impact of ECCA’s closure, a range of aircraft movements has been developed 2034 9,294,497 2,304,822 1,202,286 12,801,605 0 2035 9,498,088 2,363,419 1,251,948 13,113,455 2005 2010 2015 2020 2025 2030 2035 <strong>Edmonton</strong> <strong>International</strong> <strong>Airport</strong> Draft Master Plan Chapter 3 35