SIP Insure - Prudential ICICI Asset Management
SIP Insure - Prudential ICICI Asset Management
SIP Insure - Prudential ICICI Asset Management

You also want an ePaper? Increase the reach of your titles
YUMPU automatically turns print PDFs into web optimized ePapers that Google loves.
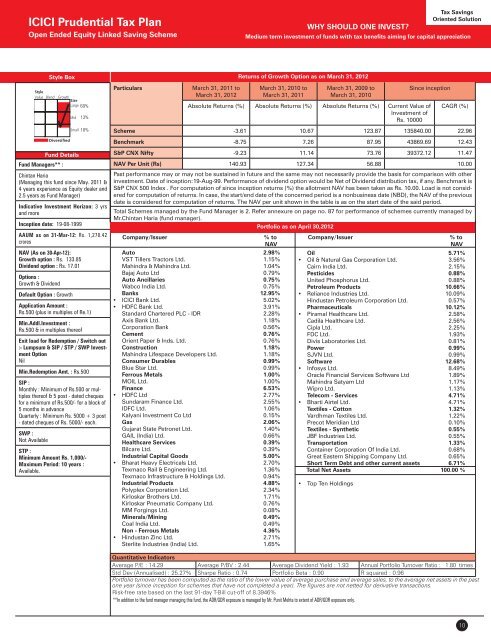
<strong>ICICI</strong> <strong>Prudential</strong> Tax Plan<br />
Open Ended Equity Linked Saving Scheme<br />
Tax Savings<br />
Oriented Solution<br />
WHY SHOULD ONE INVEST<br />
Medium term investment of funds with tax benefits aiming for capital appreciation<br />
Style Box<br />
51% 69%<br />
13%<br />
18%<br />
Fund Details<br />
Fund Managers** :<br />
Chintan Haria<br />
(Managing this fund since May. 2011 &<br />
4 years experiance as Equity dealer and<br />
2.5 years as Fund Manager)<br />
Indicative Investment Horizon: 3 yrs<br />
and more<br />
Inception date: 19-08-1999<br />
AAUM as on 31-Mar-12: Rs. 1,278.42<br />
crores<br />
NAV (As on 30-Apr-12):<br />
Growth option : Rs. 133.85<br />
Dividend option : Rs. 17.01<br />
Options :<br />
Growth & Dividend<br />
Default Option : Growth<br />
Application Amount :<br />
Rs.500 (plus in multiples of Re.1)<br />
Min.Addl.Investment :<br />
Rs.500 & in multiples thereof<br />
Exit load for Redemption / Switch out<br />
:- Lumpsum & <strong>SIP</strong> / STP / SWP Investment<br />
Option<br />
Nil<br />
Min.Redemption Amt. : Rs.500<br />
<strong>SIP</strong> :<br />
Monthly : Minimum of Rs.500 or multiples<br />
thereof & 5 post - dated cheques<br />
for a minimum of Rs.500/- for a block of<br />
5 months in advance<br />
Quarterly : Minimum Rs. 5000 + 3 post<br />
- dated cheques of Rs. 5000/- each.<br />
SWP :<br />
Not Available<br />
STP :<br />
Minimum Amount Rs. 1,000/-<br />
Maximum Period: 10 years :<br />
Available.<br />
Particulars<br />
March 31, 2011 to<br />
March 31, 2012<br />
March 31, 2010 to<br />
March 31, 2011<br />
Company/Issuer<br />
% to<br />
NAV<br />
Auto 2.98%<br />
VST Tillers Tractors Ltd. 1.15%<br />
Mahindra & Mahindra Ltd. 1.04%<br />
Bajaj Auto Ltd 0.79%<br />
Auto Ancillaries 0.75%<br />
Wabco India Ltd. 0.75%<br />
Banks 12.95%<br />
<strong>ICICI</strong> Bank Ltd. 5.02%<br />
HDFC Bank Ltd. 3.91%<br />
Standard Chartered PLC - IDR 2.28%<br />
Axis Bank Ltd. 1.18%<br />
Corporation Bank 0.56%<br />
Cement 0.76%<br />
Orient Paper & Inds. Ltd. 0.76%<br />
Construction 1.18%<br />
Mahindra Lifespace Developers Ltd. 1.18%<br />
Consumer Durables 0.99%<br />
Blue Star Ltd. 0.99%<br />
Ferrous Metals 1.00%<br />
MOIL Ltd. 1.00%<br />
Finance 6.53%<br />
HDFC Ltd 2.77%<br />
Sundaram Finance Ltd. 2.55%<br />
IDFC Ltd. 1.06%<br />
Kalyani Investment Co Ltd 0.15%<br />
Gas 2.06%<br />
Gujarat State Petronet Ltd. 1.40%<br />
GAIL (India) Ltd. 0.66%<br />
Healthcare Services 0.39%<br />
Bilcare Ltd. 0.39%<br />
Industrial Capital Goods 5.00%<br />
Bharat Heavy Electricals Ltd. 2.70%<br />
Texmaco Rail & Engineering Ltd. 1.36%<br />
Texmaco Infrastructure & Holdings Ltd. 0.94%<br />
Industrial Products 4.88%<br />
Polyplex Corporation Ltd. 2.34%<br />
Kirloskar Brothers Ltd. 1.71%<br />
Kirloskar Pneumatic Company Ltd. 0.76%<br />
MM Forgings Ltd. 0.08%<br />
Minerals/Mining 0.49%<br />
Coal India Ltd. 0.49%<br />
Non - Ferrous Metals 4.36%<br />
Hindustan Zinc Ltd. 2.71%<br />
Sterlite Industries (India) Ltd. 1.65%<br />
Returns of Growth Option as on March 31, 2012<br />
Oil 5.71%<br />
Oil & Natural Gas Corporation Ltd. 3.56%<br />
Cairn India Ltd. 2.15%<br />
Pesticides 0.88%<br />
United Phosphorus Ltd. 0.88%<br />
Petroleum Products 10.66%<br />
Reliance Industries Ltd. 10.09%<br />
Hindustan Petroleum Corporation Ltd. 0.57%<br />
Pharmaceuticals 10.12%<br />
Piramal Healthcare Ltd. 2.58%<br />
Cadila Healthcare Ltd. 2.56%<br />
Cipla Ltd. 2.25%<br />
FDC Ltd. 1.93%<br />
Divis Laboratories Ltd. 0.81%<br />
Power 0.99%<br />
SJVN Ltd. 0.99%<br />
Software 12.68%<br />
Infosys Ltd. 8.49%<br />
Oracle Financial Services Software Ltd 1.89%<br />
Mahindra Satyam Ltd 1.17%<br />
Wipro Ltd. 1.13%<br />
Telecom - Services 4.71%<br />
Bharti Airtel Ltd. 4.71%<br />
Textiles - Cotton 1.32%<br />
Vardhman Textiles Ltd. 1.22%<br />
Precot Meridian Ltd 0.10%<br />
Textiles - Synthetic 0.55%<br />
JBF Industries Ltd. 0.55%<br />
Transportation 1.33%<br />
Container Corporation Of India Ltd. 0.68%<br />
Great Eastern Shipping Company Ltd. 0.65%<br />
Short Term Debt and other current assets 6.71%<br />
Total Net <strong>Asset</strong>s 100.00 %<br />
<br />
March 31, 2009 to<br />
March 31, 2010<br />
Top Ten Holdings<br />
Since inception<br />
Absolute Returns (%) Absolute Returns (%) Absolute Returns (%) Current Value of<br />
Investment of<br />
Rs. 10000<br />
CAGR (%)<br />
Scheme -3.61 10.67 123.87 135840.00 22.96<br />
Benchmark -8.75 7.26 87.95 43869.69 12.43<br />
S&P CNX Nifty -9.23 11.14 73.76 39372.12 11.47<br />
NAV Per Unit (Rs) 140.93 127.34 56.88 10.00<br />
Past performance may or may not be sustained in future and the same may not necessarily provide the basis for comparison with other<br />
investment. Date of inception:19-Aug-99. Performance of dividend option would be Net of Dividend distribution tax, if any. Benchmark is<br />
S&P CNX 500 Index . For computation of since inception returns (%) the allotment NAV has been taken as Rs. 10.00. Load is not considered<br />
for computation of returns. In case, the start/end date of the concerned period is a nonbusiness date (NBD), the NAV of the previous<br />
date is considered for computation of returns. The NAV per unit shown in the table is as on the start date of the said period.<br />
Total Schemes managed by the Fund Manager is 2. Refer annexure on page no. 87 for performance of schemes currently managed by<br />
Mr.Chintan Haria (fund manager).<br />
Portfolio as on April 30,2012<br />
Company/Issuer<br />
Quantitative Indicators<br />
Average P/E : 14.29 Average P/BV : 2.44 Average Dividend Yield : 1.93 Annual Portfolio Turnover Ratio : 1.80 times<br />
Std Dev (Annualised) : 25.27% Sharpe Ratio : 0.74 Portfolio Beta : 0.90 R squared : 0.96<br />
Portfolio turnover has been computed as the ratio of the lower value of average purchase and average sales, to the average net assets in the past<br />
one year (since inception for schemes that have not completed a year). The figures are not netted for derivative transactions.<br />
Risk-free rate based on the last 91-day T-Bill cut-off of 8.3946%<br />
**In addition to the fund manager managing this fund, the ADR/GDR exposure is managed by Mr. Punit Mehta to extent of ADR/GDR exposure only.<br />
% to<br />
NAV<br />
10