SIP Insure - Prudential ICICI Asset Management
SIP Insure - Prudential ICICI Asset Management
SIP Insure - Prudential ICICI Asset Management

Create successful ePaper yourself
Turn your PDF publications into a flip-book with our unique Google optimized e-Paper software.
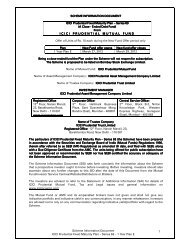
<strong>ICICI</strong> <strong>Prudential</strong> Infrastructure Fund<br />
Open Ended Equity Fund<br />
Wealth Creation<br />
Oriented Solution<br />
WHY SHOULD ONE INVEST<br />
Long term investment of funds having potential for capital appreciation derived<br />
from the growth and development of the infrastructure sector<br />
Style Box<br />
Fund Details<br />
Fund Managers** :<br />
Yogesh Bhatt<br />
(Managing this fund since Feb, 2012<br />
& 20 Years of experience in Fund<br />
Mangement)<br />
Indicative Investment Horizon: 5 yrs<br />
and more<br />
Inception date: 31-08-2005<br />
AAUM as on 31-Mar-12: Rs. 2,153.67<br />
crores<br />
NAV (As on 30-Apr-12):<br />
Growth option : Rs. 24.69<br />
Dividend option : Rs. 9.94<br />
Institutional option-I : Rs. 13.54<br />
Options :<br />
Growth & Dividend<br />
Institutional (Growth & Dividend) &<br />
Institutional Option I (Growth)<br />
Default Option : Growth<br />
Application Amount :<br />
Retail: Rs.5000 (plus in multiples of<br />
Re.1)<br />
Institutional: Rs.20 Crores,<br />
Institutional I: Rs. 1 Crore (plus in<br />
multiples of Re.1)<br />
Min.Addl. Investment :<br />
Retail & institutional I: Rs.1,000 (plus in<br />
multiple of Re. 1/-<br />
Institutional: Rs. 500 and thereof<br />
Exit load for Redemption / Switch out<br />
:- Lumpsum & <strong>SIP</strong> / STP / SWP Investment<br />
Option<br />
Upto 1 Year from allotment - 1% of applicable<br />
NAV, more than 1 Year - Nil<br />
Min.Redemption Amt. : Rs.500<br />
<strong>SIP</strong> :<br />
Monthly: Minimum Rs. 1,000/- plus 5<br />
post dated cheques for a minimum of<br />
Rs. 1,000/- each; Quarterly: Minimum<br />
Rs. 5,000/- plus 3 post dated cheques<br />
of Rs. 5,000/- each.<br />
SWP :<br />
Minimum of Rs.500 and multiples of<br />
Re.1/-<br />
STP :<br />
Minimum Amount Rs. 1,000/-<br />
Maximum Period: 10 years :<br />
Available.<br />
83%<br />
10%<br />
7%<br />
Particulars<br />
March 31, 2011 to<br />
March 31, 2012<br />
Returns of Growth Option as on March 31, 2012<br />
March 31, 2010 to<br />
March 31, 2011<br />
March 31, 2009 to<br />
March 31, 2010<br />
Absolute Returns (%) Absolute Returns (%) Absolute Returns (%) Current Value<br />
of Investment<br />
of Rs. 10000<br />
Since inception<br />
CAGR (%)<br />
Scheme -15.39 1.64 67.51 25180.00 15.06<br />
Benchmark -18.45 -10.11 44.46 14412.95 5.71<br />
S&P CNX Nifty -9.23 11.14 73.76 22206.82 12.88<br />
NAV Per Unit (Rs) 29.76 29.28 17.48 10.00<br />
Past performance may or may not be sustained in future and the same may not necessarily provide the basis for comparison with other<br />
investment. Date of inception:31-Aug-05. Performance of dividend option would be Net of Dividend distribution tax, if any. Benchmark<br />
is CNX Infrastructure Index. For computation of since inception returns (%) the allotment NAV has been taken as Rs. 10.00. Load is not<br />
considered for computation of returns. In case, the start/end date of the concerned period is a nonbusiness date (NBD), the NAV of the<br />
previous date is considered for computation of returns. The NAV per unit shown in the table is as on the start date of the said period.<br />
Total Schemes managed by the Fund Manager is 6. Refer annexure on page no. 87 for performance of schemes currently managed by<br />
Mr. Yogesh Bhatt (fund manager).<br />
Company/Issuer % to % to NAV<br />
NAV Derivatives<br />
Auto 1.39%<br />
Tata Motors Ltd. 1.39%<br />
Banks 19.93%<br />
HDFC Bank Ltd. 6.35%<br />
<strong>ICICI</strong> Bank Ltd. 5.44%<br />
State Bank Of India 3.63%<br />
Axis Bank Ltd. 2.45%<br />
Corporation Bank 1.64%<br />
Bank Of Baroda 0.41%<br />
Cement 2.14%<br />
Birla Corporation Ltd. 1.13%<br />
Orient Paper & Inds. Ltd. 1.01%<br />
Construction Project 3.47%<br />
Larsen & Toubro Ltd. 3.21%<br />
Voltas Ltd. 0.26%<br />
Consumer Durables 0.21%<br />
Blue Star Ltd. 0.21%<br />
Ferrous Metals 4.61% 0.71%<br />
Tata Steel Ltd. 3.15%<br />
Tata Steel Ltd.-Futures 0.71%<br />
Usha Martin Ltd. 1.03%<br />
Electrosteel Steels Ltd. 0.42%<br />
Finance 3.42%<br />
IDFC Ltd. 1.57%<br />
Mahindra & Mahindra Financial Services Ltd. 0.97%<br />
HDFC Ltd 0.89%<br />
Gas 0.28%<br />
GAIL (India) Ltd. 0.28%<br />
Hotels 0.63%<br />
Indian Hotels Company Ltd. 0.63%<br />
Industrial Capital Goods 5.41%<br />
Bharat Heavy Electricals Ltd. 3.11%<br />
Texmaco Rail & Engineering Ltd. 1.37%<br />
Techno Electric & Engineering Co Ltd. 0.56%<br />
BEML Ltd. 0.30%<br />
Texmaco Infrastructure & Holdings Ltd. 0.08%<br />
Industrial Products 0.90%<br />
Cummins India Ltd. 0.48%<br />
Portfolio as on April 30,2012<br />
Company/Issuer % to % to NAV<br />
NAV Derivatives<br />
Electrosteel Castings Ltd. 0.42%<br />
Minerals/Mining 3.45%<br />
Coal India Ltd. 1.82%<br />
Sesa Goa Ltd. 1.63%<br />
Non - Ferrous Metals 5.38%<br />
Sterlite Industries (India) Ltd. 2.96%<br />
Hindustan Zinc Ltd. 2.42%<br />
Oil 10.32%<br />
Oil & Natural Gas Corporation Ltd. 6.91%<br />
Cairn India Ltd. 3.06%<br />
Oil India Ltd 0.36%<br />
Petroleum Products 7.89%<br />
Reliance Industries Ltd. 7.89%<br />
Power 14.59%<br />
Power Grid Corporation Of India Ltd. 4.21%<br />
Tata Power Company Ltd. 3.40%<br />
Kalpataru Power Transmission Ltd. 2.26%<br />
SJVN Ltd. 2.15%<br />
CESC Ltd. 1.50%<br />
NTPC Ltd. 0.95%<br />
NHPC Ltd. 0.12%<br />
Telecom - Services 6.81%<br />
Bharti Airtel Ltd. 6.81%<br />
Textile Products 0.76%<br />
Grasim Industries Ltd. 0.76%<br />
Transportation 2.40%<br />
Great Eastern Shipping Company Ltd. 1.96%<br />
Container Corporation Of India Ltd. 0.44%<br />
Index Futures/Options 1.00%<br />
S&P CNX Nifty-Futures 1.00%<br />
Short Term Debt and other current assets 4.30%<br />
Total Net <strong>Asset</strong>s 100.00 %<br />
Top Ten Holdings<br />
Derivatives are considered at exposure value.<br />
Quantitative Indicators<br />
Average P/E : 13.11 Average P/BV : 1.95 Average Dividend Yield : 1.94 Annual Portfolio Turnover Ratio : 0.31 times<br />
Std Dev (Annualised) : 22.89% Sharpe Ratio : 0.04 Portfolio Beta : 0.71 R squared : 0.92<br />
Portfolio turnover has been computed as the ratio of the lower value of average purchase and average sales, to the average net assets in the<br />
past one year (since inception for schemes that have not completed a year). The figures are not netted for derivative transactions.<br />
Risk-free rate based on the last 91-day T-Bill cut-off of 8.3946%<br />
** In addition to the fund manager managing this fund, the ADR/GDR exposure is managed by Mr. Punit Mehta to extent of ADR/GDR exposure only.<br />
9