SIP Insure - Prudential ICICI Asset Management
SIP Insure - Prudential ICICI Asset Management
SIP Insure - Prudential ICICI Asset Management

You also want an ePaper? Increase the reach of your titles
YUMPU automatically turns print PDFs into web optimized ePapers that Google loves.
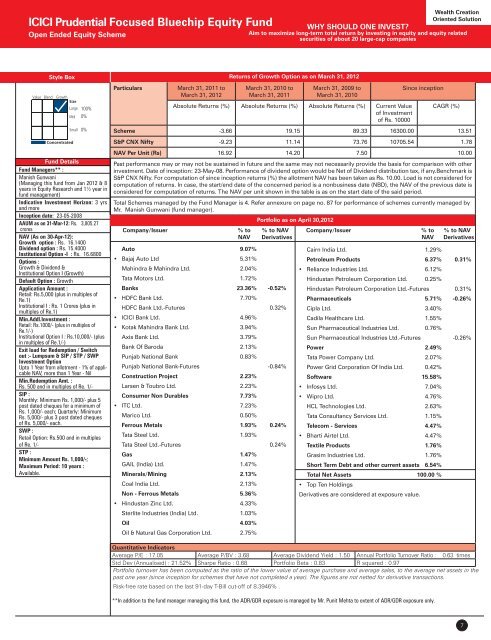
<strong>ICICI</strong> <strong>Prudential</strong> Focused Bluechip Equity Fund<br />
Open Ended Equity Scheme<br />
Wealth Creation<br />
Oriented Solution<br />
WHY SHOULD ONE INVEST<br />
Aim to maximize long-term total return by investing in equity and equity related<br />
securities of about 20 large-cap companies<br />
Style Box<br />
100%<br />
0%<br />
0%<br />
Fund Details<br />
Fund Managers** :<br />
Manish Gunwani<br />
(Managing this fund from Jan 2012 & 8<br />
years in Equity Research and 1½ year in<br />
fund management)<br />
Indicative Investment Horizon: 3 yrs<br />
and more<br />
Inception date: 23-05-2008<br />
AAUM as on 31-Mar-12: Rs. 3,805.27<br />
crores<br />
NAV (As on 30-Apr-12):<br />
Growth option : Rs. 16.1400<br />
Dividend option : Rs. 15.4000<br />
Institutional Option -I : Rs. 16.6800<br />
Options :<br />
Growth & Dividend &<br />
Institutional Option I (Growth)<br />
Default Option : Growth<br />
Application Amount :<br />
Retail: Rs.5,000 (plus in multiples of<br />
Re.1)<br />
Institutional I : Rs. 1 Crores (plus in<br />
multiples of Re.1)<br />
Min.Addl.Investment :<br />
Retail: Rs.1000/- (plus in multiples of<br />
Re.1/-)<br />
Institutional Option I : Rs.10,000/- (plus<br />
in multiples of Re.1/-)<br />
Exit load for Redemption / Switch<br />
out :- Lumpsum & <strong>SIP</strong> / STP / SWP<br />
Investment Option<br />
Upto 1 Year from allotment - 1% of applicable<br />
NAV, more than 1 Year - Nil<br />
Min.Redemption Amt. :<br />
Rs. 500 and in multiples of Re. 1/-<br />
<strong>SIP</strong> :<br />
Monthly: Minimum Rs. 1,000/- plus 5<br />
post dated cheques for a minimum of<br />
Rs. 1,000/- each; Quarterly: Minimum<br />
Rs. 5,000/- plus 3 post dated cheques<br />
of Rs. 5,000/- each.<br />
SWP :<br />
Retail Option: Rs.500 and in multiples<br />
of Re. 1/-<br />
STP :<br />
Minimum Amount Rs. 1,000/-;<br />
Maximum Period: 10 years :<br />
Available.<br />
Particulars<br />
March 31, 2011 to<br />
March 31, 2012<br />
Company/Issuer % to % to NAV<br />
NAV Derivatives<br />
Auto 9.07%<br />
Bajaj Auto Ltd 5.31%<br />
Mahindra & Mahindra Ltd. 2.04%<br />
Tata Motors Ltd. 1.72%<br />
Banks 23.36% -0.52%<br />
HDFC Bank Ltd. 7.70%<br />
HDFC Bank Ltd.-Futures 0.32%<br />
<strong>ICICI</strong> Bank Ltd. 4.96%<br />
Kotak Mahindra Bank Ltd. 3.94%<br />
Axis Bank Ltd. 3.79%<br />
Bank Of Baroda 2.13%<br />
Punjab National Bank 0.83%<br />
Punjab National Bank-Futures -0.84%<br />
Construction Project 2.23%<br />
Larsen & Toubro Ltd. 2.23%<br />
Consumer Non Durables 7.73%<br />
ITC Ltd. 7.23%<br />
Marico Ltd. 0.50%<br />
Ferrous Metals 1.93% 0.24%<br />
Tata Steel Ltd. 1.93%<br />
Tata Steel Ltd.-Futures 0.24%<br />
Gas 1.47%<br />
GAIL (India) Ltd. 1.47%<br />
Minerals/Mining 2.13%<br />
Coal India Ltd. 2.13%<br />
Non - Ferrous Metals 5.36%<br />
Hindustan Zinc Ltd. 4.33%<br />
Sterlite Industries (India) Ltd. 1.03%<br />
Oil 4.03%<br />
Oil & Natural Gas Corporation Ltd. 2.75%<br />
Returns of Growth Option as on March 31, 2012<br />
March 31, 2010 to<br />
March 31, 2011<br />
March 31, 2009 to<br />
March 31, 2010<br />
Absolute Returns (%) Absolute Returns (%) Absolute Returns (%) Current Value<br />
of Investment<br />
of Rs. 10000<br />
Since inception<br />
Company/Issuer % to % to NAV<br />
NAV Derivatives<br />
Quantitative Indicators<br />
Average P/E : 17.05 Average P/BV : 3.68 Average Dividend Yield : 1.50 Annual Portfolio Turnover Ratio : 0.63 times<br />
Std Dev (Annualised) : 21.52% Sharpe Ratio : 0.68 Portfolio Beta : 0.83 R squared : 0.97<br />
Portfolio turnover has been computed as the ratio of the lower value of average purchase and average sales, to the average net assets in the<br />
past one year (since inception for schemes that have not completed a year). The figures are not netted for derivative transactions.<br />
Risk-free rate based on the last 91-day T-Bill cut-off of 8.3946% .<br />
**In addition to the fund manager managing this fund, the ADR/GDR exposure is managed by Mr. Punit Mehta to extent of ADR/GDR exposure only.<br />
CAGR (%)<br />
Scheme -3.66 19.15 89.33 16300.00 13.51<br />
S&P CNX Nifty -9.23 11.14 73.76 10705.54 1.78<br />
NAV Per Unit (Rs) 16.92 14.20 7.50 10.00<br />
Past performance may or may not be sustained in future and the same may not necessarily provide the basis for comparison with other<br />
investment. Date of inception: 23-May-08. Performance of dividend option would be Net of Dividend distribution tax, if any.Benchmark is<br />
S&P CNX Nifty. For computation of since inception returns (%) the allotment NAV has been taken as Rs. 10.00. Load is not considered for<br />
computation of returns. In case, the start/end date of the concerned period is a nonbusiness date (NBD), the NAV of the previous date is<br />
considered for computation of returns. The NAV per unit shown in the table is as on the start date of the said period.<br />
Total Schemes managed by the Fund Manager is 4. Refer annexure on page no. 87 for performance of schemes currently managed by<br />
Mr. Manish Gunwani (fund manager).<br />
Portfolio as on April 30,2012<br />
Cairn India Ltd. 1.29%<br />
Petroleum Products 6.37% 0.31%<br />
Reliance Industries Ltd. 6.12%<br />
Hindustan Petroleum Corporation Ltd. 0.25%<br />
Hindustan Petroleum Corporation Ltd.-Futures 0.31%<br />
Pharmaceuticals 5.71% -0.26%<br />
Cipla Ltd. 3.40%<br />
Cadila Healthcare Ltd. 1.55%<br />
Sun Pharmaceutical Industries Ltd. 0.76%<br />
Sun Pharmaceutical Industries Ltd.-Futures -0.26%<br />
Power 2.49%<br />
Tata Power Company Ltd. 2.07%<br />
Power Grid Corporation Of India Ltd. 0.42%<br />
Software 15.58%<br />
Infosys Ltd. 7.04%<br />
Wipro Ltd. 4.76%<br />
HCL Technologies Ltd. 2.63%<br />
Tata Consultancy Services Ltd. 1.15%<br />
Telecom - Services 4.47%<br />
Bharti Airtel Ltd. 4.47%<br />
Textile Products 1.76%<br />
Grasim Industries Ltd. 1.76%<br />
Short Term Debt and other current assets 6.54%<br />
Total Net <strong>Asset</strong>s 100.00 %<br />
Top Ten Holdings<br />
Derivatives are considered at exposure value.<br />
7