SIP Insure - Prudential ICICI Asset Management
SIP Insure - Prudential ICICI Asset Management
SIP Insure - Prudential ICICI Asset Management

Create successful ePaper yourself
Turn your PDF publications into a flip-book with our unique Google optimized e-Paper software.
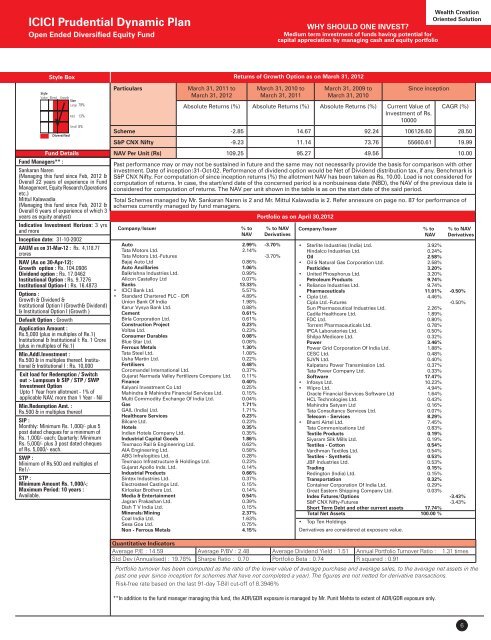
<strong>ICICI</strong> <strong>Prudential</strong> Dynamic Plan<br />
Open Ended Diversified Equity Fund<br />
Wealth Creation<br />
Oriented Solution<br />
WHY SHOULD ONE INVEST<br />
Medium term investment of funds having potential for<br />
capital appreciation by managing cash and equity portfolio<br />
Style Box<br />
Returns of Growth Option as on March 31, 2012<br />
79%<br />
13%<br />
Fund Details<br />
Fund Managers** :<br />
Sankaran Naren<br />
(Managing this fund since Feb, 2012 &<br />
Overall 22 years of experience in Fund<br />
<strong>Management</strong>, Equity Research,Operations<br />
etc.)<br />
Mittul Kalawadia<br />
(Managing this fund since Feb, 2012 &<br />
Overall 6 years of experience of which 3<br />
years as equity analyst)<br />
Indicative Investment Horizon: 3 yrs<br />
and more<br />
Inception date: 31-10-2002<br />
AAUM as on 31-Mar-12 : Rs. 4,118.77<br />
crores<br />
NAV (As on 30-Apr-12):<br />
Growth option : Rs. 104.0906<br />
Dividend option : Rs. 17.0462<br />
Institutional Option : Rs. 9.7276<br />
Institutional Option-I : Rs. 16.4873<br />
Options :<br />
Growth & Dividend &<br />
Institutional Option I (Growth& Dividend)<br />
& Institutional Option I (Growth )<br />
Default Option : Growth<br />
Application Amount :<br />
Rs.5,000 (plus in multiples of Re.1)<br />
Institutional & Institutional I: Rs. 1 Crore<br />
(plus in multiples of Re.1)<br />
Min.Addl.Investment :<br />
Rs.500 & in multiples thereof. Institutional<br />
& Institutional I : Rs. 10,000<br />
Exit load for Redemption / Switch<br />
out :- Lumpsum & <strong>SIP</strong> / STP / SWP<br />
Investment Option<br />
Upto 1 Year from allotment - 1% of<br />
applicable NAV, more than 1 Year - Nil<br />
Min.Redemption Amt. :<br />
Rs.500 & in multiples thereof<br />
<strong>SIP</strong> :<br />
Monthly: Minimum Rs. 1,000/- plus 5<br />
post dated cheques for a minimum of<br />
Rs. 1,000/- each; Quarterly: Minimum<br />
Rs. 5,000/- plus 3 post dated cheques<br />
of Rs. 5,000/- each.<br />
SWP :<br />
Minimum of Rs.500 and multiples of<br />
Re1/-<br />
STP :<br />
Minimum Amount Rs. 1,000/-;<br />
Maximum Period: 10 years :<br />
Available.<br />
8%<br />
Particulars<br />
March 31, 2011 to<br />
March 31, 2012<br />
March 31, 2010 to<br />
March 31, 2011<br />
March 31, 2009 to<br />
March 31, 2010<br />
Since inception<br />
Absolute Returns (%) Absolute Returns (%) Absolute Returns (%) Current Value of<br />
Investment of Rs.<br />
10000<br />
CAGR (%)<br />
Scheme -2.85 14.67 92.24 106126.60 28.50<br />
S&P CNX Nifty -9.23 11.14 73.76 55660.61 19.99<br />
NAV Per Unit (Rs) 109.25 95.27 49.56 10.00<br />
Past performance may or may not be sustained in future and the same may not necessarily provide the basis for comparison with other<br />
investment. Date of inception:31-Oct-02. Performance of dividend option would be Net of Dividend distribution tax, if any. Benchmark is<br />
S&P CNX Nifty. For computation of since inception returns (%) the allotment NAV has been taken as Rs. 10.00. Load is not considered for<br />
computation of returns. In case, the start/end date of the concerned period is a nonbusiness date (NBD), the NAV of the previous date is<br />
considered for computation of returns. The NAV per unit shown in the table is as on the start date of the said period.<br />
Total Schemes managed by Mr. Sankaran Naren is 2 and Mr. Mittul Kalawadia is 2. Refer annexure on page no. 87 for performance of<br />
schemes currently managed by fund managers.<br />
Company/Issuer % to % to NAV<br />
NAV Derivatives<br />
Auto 2.99% -3.70%<br />
Tata Motors Ltd. 2.14%<br />
Tata Motors Ltd.-Futures -3.70%<br />
Bajaj Auto Ltd 0.86%<br />
Auto Ancillaries 1.06%<br />
Balkrishna Industries Ltd. 0.99%<br />
Alicon Castalloy Ltd 0.07%<br />
Banks 13.33%<br />
<strong>ICICI</strong> Bank Ltd. 5.57%<br />
Standard Chartered PLC - IDR 4.89%<br />
Union Bank Of India 1.98%<br />
Karur Vysya Bank Ltd. 0.88%<br />
Cement 0.61%<br />
Birla Corporation Ltd. 0.61%<br />
Construction Project 0.23%<br />
Voltas Ltd. 0.23%<br />
Consumer Durables 0.08%<br />
Blue Star Ltd. 0.08%<br />
Ferrous Metals 1.30%<br />
Tata Steel Ltd. 1.08%<br />
Usha Martin Ltd. 0.22%<br />
Fertilisers 0.48%<br />
Coromandel International Ltd. 0.37%<br />
Gujarat Narmada Valley Fertilizers Company Ltd. 0.11%<br />
Finance 0.40%<br />
Kalyani Investment Co Ltd 0.25%<br />
Mahindra & Mahindra Financial Services Ltd. 0.15%<br />
Multi Commodity Exchange Of India Ltd. 0.04%<br />
Gas 1.71%<br />
GAIL (India) Ltd. 1.71%<br />
Healthcare Services 0.23%<br />
Bilcare Ltd. 0.23%<br />
Hotels 0.35%<br />
Indian Hotels Company Ltd. 0.35%<br />
Industrial Capital Goods 1.86%<br />
Texmaco Rail & Engineering Ltd. 0.62%<br />
AIA Engineering Ltd. 0.58%<br />
ABG Infralogitics Ltd. 0.28%<br />
Texmaco Infrastructure & Holdings Ltd. 0.23%<br />
Gujarat Apollo Inds. Ltd. 0.14%<br />
Industrial Products 0.66%<br />
Sintex Industries Ltd. 0.37%<br />
Electrosteel Castings Ltd. 0.15%<br />
Kirloskar Brothers Ltd. 0.14%<br />
Media & Entertainment 0.54%<br />
Jagran Prakashan Ltd. 0.39%<br />
Dish T V India Ltd. 0.15%<br />
Minerals/Mining 2.37%<br />
Coal India Ltd. 1.63%<br />
Sesa Goa Ltd. 0.75%<br />
Non - Ferrous Metals 4.15%<br />
Portfolio as on April 30,2012<br />
Company/Issuer % to % to NAV<br />
NAV Derivatives<br />
Sterlite Industries (India) Ltd. 3.92%<br />
Hindalco Industries Ltd. 0.24%<br />
Oil 2.58%<br />
Oil & Natural Gas Corporation Ltd. 2.58%<br />
Pesticides 3.20%<br />
United Phosphorus Ltd. 3.20%<br />
Petroleum Products 9.74%<br />
Reliance Industries Ltd. 9.74%<br />
Pharmaceuticals 11.01% -0.50%<br />
Cipla Ltd. 4.46%<br />
Cipla Ltd.-Futures -0.50%<br />
Sun Pharmaceutical Industries Ltd. 2.26%<br />
Cadila Healthcare Ltd. 1.89%<br />
FDC Ltd. 0.80%<br />
Torrent Pharmaceuticals Ltd. 0.78%<br />
IPCA Laboratories Ltd. 0.50%<br />
Shilpa Medicare Ltd. 0.32%<br />
Power 3.46%<br />
Power Grid Corporation Of India Ltd. 1.88%<br />
CESC Ltd. 0.48%<br />
SJVN Ltd. 0.40%<br />
Kalpataru Power Transmission Ltd. 0.37%<br />
Tata Power Company Ltd. 0.33%<br />
Software 17.47%<br />
Infosys Ltd. 10.23%<br />
Wipro Ltd. 4.94%<br />
Oracle Financial Services Software Ltd 1.64%<br />
HCL Technologies Ltd. 0.43%<br />
Mahindra Satyam Ltd 0.16%<br />
Tata Consultancy Services Ltd. 0.07%<br />
Telecom - Services 8.29%<br />
Bharti Airtel Ltd. 7.45%<br />
Tata Communications Ltd 0.83%<br />
Textile Products 0.19%<br />
Siyaram Silk Mills Ltd. 0.19%<br />
Textiles - Cotton 0.54%<br />
Vardhman Textiles Ltd. 0.54%<br />
Textiles - Synthetic 0.53%<br />
JBF Industries Ltd. 0.53%<br />
Trading 0.15%<br />
Redington (India) Ltd. 0.15%<br />
Transportation 0.32%<br />
Container Corporation Of India Ltd. 0.29%<br />
Great Eastern Shipping Company Ltd. 0.03%<br />
Index Futures/Options -3.43%<br />
S&P CNX Nifty-Futures -3.43%<br />
Short Term Debt and other current assets 17.74%<br />
Total Net <strong>Asset</strong>s 100.00 %<br />
Top Ten Holdings<br />
Derivatives are considered at exposure value.<br />
Quantitative Indicators<br />
Average P/E : 14.59 Average P/BV : 2.48 Average Dividend Yield : 1.51 Annual Portfolio Turnover Ratio : 1.31 times<br />
Std Dev (Annualised) : 19.78% Sharpe Ratio : 0.70 Portfolio Beta : 0.74 R squared : 0.91<br />
Portfolio turnover has been computed as the ratio of the lower value of average purchase and average sales, to the average net assets in the<br />
past one year (since inception for schemes that have not completed a year). The figures are not netted for derivative transactions.<br />
Risk-free rate based on the last 91-day T-Bill cut-off of 8.3946%<br />
**In addition to the fund manager managing this fund, the ADR/GDR exposure is managed by Mr. Punit Mehta to extent of ADR/GDR exposure only.<br />
6