SIP Insure - Prudential ICICI Asset Management
SIP Insure - Prudential ICICI Asset Management
SIP Insure - Prudential ICICI Asset Management

You also want an ePaper? Increase the reach of your titles
YUMPU automatically turns print PDFs into web optimized ePapers that Google loves.
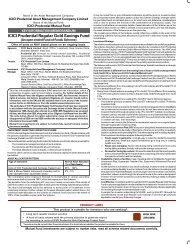
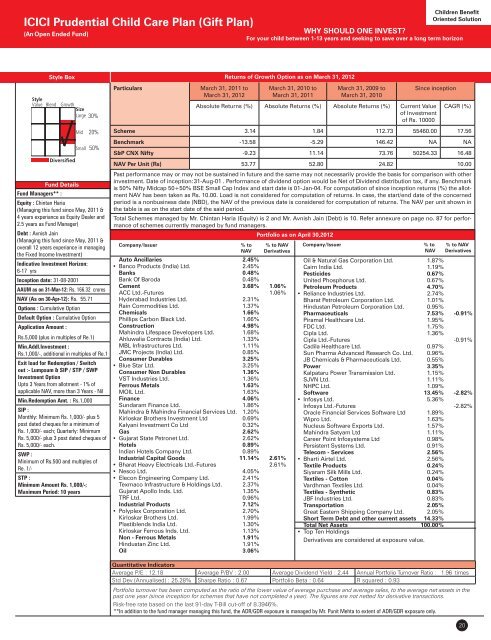
<strong>ICICI</strong> <strong>Prudential</strong> Child Care Plan (Gift Plan)<br />
(An Open Ended Fund)<br />
Children Benefit<br />
Oriented Solution<br />
WHY SHOULD ONE INVEST<br />
For your child between 1-13 years and seeking to save over a long term horizon<br />
Style Box<br />
30%<br />
20%<br />
50%<br />
Fund Details<br />
Fund Managers** :<br />
Equity : Chintan Haria<br />
(Managing this fund since May, 2011 &<br />
4 years experiance as Equity Dealer and<br />
2.5 years as Fund Manager)<br />
Debt : Avnish Jain<br />
(Managing this fund since May, 2011 &<br />
overall 12 years experiance in managing<br />
the Fixed Income Investment)<br />
Indicative Investment Horizon:<br />
6-17 yrs<br />
Inception date: 31-08-2001<br />
AAUM as on 31-Mar-12: Rs. 166.32 crores<br />
NAV (As on 30-Apr-12): Rs. 55.71<br />
Options : Cumulative Option<br />
Default Option : Cumulative Option<br />
Application Amount :<br />
Rs.5,000 (plus in multiples of Re.1)<br />
Min.Addl.Investment :<br />
Rs.1,000/-, additional in multiples of Re.1<br />
Exit load for Redemption / Switch<br />
out :- Lumpsum & <strong>SIP</strong> / STP / SWP<br />
Investment Option<br />
Upto 3 Years from allotment - 1% of<br />
applicable NAV, more than 3 Years - Nil<br />
Min.Redemption Amt. : Rs.1,000<br />
<strong>SIP</strong> :<br />
Monthly: Minimum Rs. 1,000/- plus 5<br />
post dated cheques for a minimum of<br />
Rs. 1,000/- each; Quarterly: Minimum<br />
Rs. 5,000/- plus 3 post dated cheques of<br />
Rs. 5,000/- each.<br />
SWP :<br />
Minimum of Rs.500 and multiples of<br />
Re. 1/-<br />
STP :<br />
Minimum Amount Rs. 1,000/-;<br />
Maximum Period: 10 years<br />
Particulars<br />
March 31, 2011 to<br />
March 31, 2012<br />
Auto Ancillaries 2.45%<br />
Banco Products (India) Ltd. 2.45%<br />
Banks 0.48%<br />
Bank Of Baroda 0.48%<br />
Cement 3.68% 1.06%<br />
ACC Ltd.-Futures 1.06%<br />
Hyderabad Industries Ltd. 2.31%<br />
Rain Commodities Ltd. 1.37%<br />
Chemicals 1.66%<br />
Phillips Carbon Black Ltd. 1.66%<br />
Construction 4.98%<br />
Mahindra Lifespace Developers Ltd. 1.68%<br />
Ahluwalia Contracts (India) Ltd. 1.33%<br />
MBL Infrastructures Ltd. 1.11%<br />
JMC Projects (India) Ltd. 0.85%<br />
Consumer Durables 3.25%<br />
Blue Star Ltd. 3.25%<br />
Consumer Non Durables 1.36%<br />
VST Industries Ltd. 1.36%<br />
Ferrous Metals 1.63%<br />
MOIL Ltd. 1.63%<br />
Finance 4.06%<br />
Sundaram Finance Ltd. 1.86%<br />
Mahindra & Mahindra Financial Services Ltd. 1.20%<br />
Kirloskar Brothers Investment Ltd 0.69%<br />
Kalyani Investment Co Ltd 0.32%<br />
Gas 2.62%<br />
Gujarat State Petronet Ltd. 2.62%<br />
Hotels 0.89%<br />
Indian Hotels Company Ltd. 0.89%<br />
Industrial Capital Goods 11.14% 2.61%<br />
Bharat Heavy Electricals Ltd.-Futures 2.61%<br />
Nesco Ltd. 4.05%<br />
Elecon Engineering Company Ltd. 2.41%<br />
Texmaco Infrastructure & Holdings Ltd. 2.37%<br />
Gujarat Apollo Inds. Ltd. 1.35%<br />
TRF Ltd. 0.96%<br />
Industrial Products 7.12%<br />
Polyplex Corporation Ltd. 2.70%<br />
Kirloskar Brothers Ltd. 1.99%<br />
Plastiblends India Ltd. 1.30%<br />
Kirloskar Ferrous Inds. Ltd. 1.13%<br />
Non - Ferrous Metals 1.91%<br />
Hindustan Zinc Ltd. 1.91%<br />
Oil 3.06%<br />
Returns of Growth Option as on March 31, 2012<br />
March 31, 2010 to<br />
March 31, 2011<br />
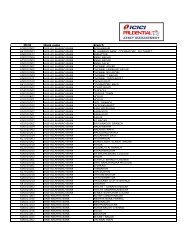
Portfolio as on April 30,2012<br />
March 31, 2009 to<br />
March 31, 2010<br />
Since inception<br />
Absolute Returns (%) Absolute Returns (%) Absolute Returns (%) Current Value<br />
of Investment<br />
of Rs. 10000<br />
CAGR (%)<br />
Scheme 3.14 1.84 112.73 55460.00 17.56<br />
Benchmark -13.58 -5.29 146.42 NA NA<br />
S&P CNX Nifty -9.23 11.14 73.76 50254.33 16.48<br />
NAV Per Unit (Rs) 53.77 52.80 24.82 10.00<br />
Past performance may or may not be sustained in future and the same may not necessarily provide the basis for comparison with other<br />
investment. Date of inception:31-Aug-01 . Performance of dividend option would be Net of Dividend distribution tax, if any. Benchmark<br />
is 50% Nifty Midcap 50+50% BSE Small Cap Index and start date is 01-Jan-04. For computation of since inception returns (%) the allotment<br />
NAV has been taken as Rs. 10.00. Load is not considered for computation of returns. In case, the start/end date of the concerned<br />
period is a nonbusiness date (NBD), the NAV of the previous date is considered for computation of returns. The NAV per unit shown in<br />
the table is as on the start date of the said period.<br />
Total Schemes managed by Mr. Chintan Haria (Equity) is 2 and Mr. Avnish Jain (Debt) is 10. Refer annexure on page no. 87 for performance<br />
of schemes currently managed by fund managers.<br />
Company/Issuer % to % to NAV<br />
NAV Derivatives<br />
Company/Issuer % to % to NAV<br />
NAV Derivatives<br />
Oil & Natural Gas Corporation Ltd. 1.87%<br />
Cairn India Ltd. 1.19%<br />
Pesticides 0.67%<br />
United Phosphorus Ltd. 0.67%<br />
Petroleum Products 4.70%<br />
Reliance Industries Ltd. 2.74%<br />
Bharat Petroleum Corporation Ltd. 1.01%<br />
Hindustan Petroleum Corporation Ltd. 0.95%<br />
Pharmaceuticals 7.53% -0.91%<br />
Piramal Healthcare Ltd. 1.95%<br />
FDC Ltd. 1.75%<br />
Cipla Ltd. 1.36%<br />
Cipla Ltd.-Futures -0.91%<br />
Cadila Healthcare Ltd. 0.97%<br />
Sun Pharma Advanced Research Co. Ltd. 0.96%<br />
JB Chemicals & Pharmaceuticals Ltd. 0.55%<br />
Power 3.35%<br />
Kalpataru Power Transmission Ltd. 1.15%<br />
SJVN Ltd. 1.11%<br />
NHPC Ltd. 1.09%<br />
Software 13.45% -2.82%<br />
Infosys Ltd. 5.36%<br />
Infosys Ltd.-Futures -2.82%<br />
Oracle Financial Services Software Ltd 1.89%<br />
Wipro Ltd. 1.63%<br />
Nucleus Software Exports Ltd. 1.57%<br />
Mahindra Satyam Ltd 1.11%<br />
Career Point Infosystems Ltd 0.98%<br />
Persistent Systems Ltd. 0.91%<br />
Telecom - Services 2.56%<br />
Bharti Airtel Ltd. 2.56%<br />
Textile Products 0.24%<br />
Siyaram Silk Mills Ltd. 0.24%<br />
Textiles - Cotton 0.04%<br />
Vardhman Textiles Ltd. 0.04%<br />
Textiles - Synthetic 0.83%<br />
JBF Industries Ltd. 0.83%<br />
Transportation 2.05%<br />
Great Eastern Shipping Company Ltd. 2.05%<br />
Short Term Debt and other current assets 14.33%<br />
Total Net <strong>Asset</strong>s 100.00%<br />
Top Ten Holdings<br />
Derivatives are considered at exposure value.<br />
Quantitative Indicators<br />
Average P/E : 12.18 Average P/BV : 2.00 Average Dividend Yield : 2.44 Annual Portfolio Turnover Ratio : 1.96 times<br />
Std Dev (Annualised) : 25.28% Sharpe Ratio : 0.67 Portfolio Beta : 0.64 R squared : 0.93<br />
Portfolio turnover has been computed as the ratio of the lower value of average purchase and average sales, to the average net assets in the<br />
past one year (since inception for schemes that have not completed a year). The figures are not netted for derivative transactions.<br />
Risk-free rate based on the last 91-day T-Bill cut-off of 8.3946%.<br />
**In addition to the fund manager managing this fund, the ADR/GDR exposure is managed by Mr. Punit Mehta to extent of ADR/GDR exposure only.<br />
20