Annual Report 2012/13 - Clas Ohlson
Annual Report 2012/13 - Clas Ohlson
Annual Report 2012/13 - Clas Ohlson

You also want an ePaper? Increase the reach of your titles
YUMPU automatically turns print PDFs into web optimized ePapers that Google loves.
Organisation and responsibility<br />
Environmental efforts are a feature of <strong>Clas</strong> <strong>Ohlson</strong>’s<br />
sustainability work, which is coordinated by a CSR forum.<br />
The forum formulates targets and strategies, and plans and<br />
monitors sustainability efforts. Each function manager is<br />
subsequently responsible for measures relative to the environmental<br />
impact generated by his/her operations. Read<br />
more about <strong>Clas</strong> <strong>Ohlson</strong>’s CSR forum on page 27.<br />
Freight and business travel<br />
Our overall environmental objective is that fossil-fuel carbon<br />
dioxide emissions per tonne/kilometre for freight and person/<br />
kilometre for business travel must be reduced by 30 per cent<br />
by 2020, compared with 2007. The reduction applies to the<br />
total performance indicators for current transport modes.<br />
In <strong>2012</strong>, about 85 per cent of the goods transported by<br />
sea from Asia to Gothenburg were transported by rail to<br />
the terminal in Insjön. From January 20<strong>13</strong>, the total flow of<br />
goods will be transported by rail. Goods from Swedish and<br />
European suppliers are coordinated in several locations for<br />
transport by road to Insjön.<br />
Deliveries from the distribution centre to stores and<br />
customers mainly takes place by road but during the year,<br />
the proportion of rail and sea transport was 18 per cent,<br />
compared with 16 per cent in 2011.<br />
The performance indicator for climate impact in conjunction<br />
with business travel by road, air and rail decreased<br />
6 per cent, from 108 to 102 grams per CO 2/kilometre. The<br />
underlying factor is a higher proportion of train travel, and a<br />
lower proportion of car and air travel.<br />
Results<br />
<strong>Clas</strong> <strong>Ohlson</strong>’s total carbon dioxide emissions generated<br />
by freight increased from 15,349 tonnes (2011) to 18,161<br />
tonnes (<strong>2012</strong>). Emissions per tonne/kilometre are largely invariable,<br />
with a reduction from 6.0 grams per tonne/kilometre<br />
(2011) to 5.9 grams per tonne/kilometre (<strong>2012</strong>).<br />
Product responsibility<br />
Overall environmental objective<br />
The products we sell must have properties that meet or exceed<br />
market expectations in regard to material characteristics,<br />
energy utilisation, safety and quality. The product range<br />
and information will be developed to help our customers<br />
minimise their own environmental impact.<br />
Chemical risk substances<br />
The number of chemical substances covered by the EU<br />
REACH regulation is rapidly increasing. <strong>Clas</strong> <strong>Ohlson</strong> has<br />
worked extensively to train suppliers in legislation and the<br />
chemical risk assessment of contents in products and<br />
packaging. In addition to partnerships with laboratories in<br />
Sweden and Asia, we have also acquired sources of expertise<br />
pertaining to the properties and risk substances in materials.<br />
This increases precision when goods are subjected<br />
to chemical analyses.<br />
Phase-out of risk substances<br />
All materials and substances in products must meet the<br />
requirements of applicable legislation. We are phasing out<br />
risk substances on the REACH Candidate List by setting a<br />
maximum limit of 0.1 weight per cent. We have identified additional<br />
substances, beyond legal requirements, for textiles<br />
and leather products, which we are minimising. Our processes<br />
improved during the year and the number of substances<br />
we now test increased from 5 to 26. <strong>Clas</strong> <strong>Ohlson</strong> also applies<br />
more stringent requirements than the legally permitted<br />
levels for materials that come into contact with skin or that<br />
are used by children. The EU REACH regulation includes a<br />
requirement that consumers must be informed of the content<br />
of hazardous chemicals in goods within 45 days of a request.<br />
We have chosen to provide information directly on both<br />
the product and our website if we consider that a product<br />
contains a hazardous chemical. However, our supplier requirements<br />
stipulate that no hazardous chemicals are permitted<br />
in any products.<br />
Energy consumption * <strong>2012</strong> 2011 2010<br />
Store premises, (kWh electricity/m 2 , year)* <strong>13</strong>5 141 147<br />
Offices, (kWh/m 2 , year, total) 142 153 143<br />
Distribution Centre, (kWh/m 2 , year, total) 92 88 99<br />
Distribution Centre (kWh electricity/pallet) 19.5 20.2 22.6<br />
Fuel oil Insjön, (m 3 )<br />
.<br />
2.2 ** 0.8 9.4<br />
* Excluding stores in the UK.<br />
** Own heat generation due to disrupted district heating<br />
services, <strong>13</strong>–14 December.<br />
Total electricity consumption (GWh)<br />
<strong>2012</strong> 2011 2010<br />
Store premises* 36.1 34.0 30.9<br />
Offices 1.5 1.5 1.6<br />
Distribution Centre 4.7 4.6 5.1<br />
Fossil carbon dioxide (tonnes)<br />
<strong>2012</strong> 2011 2010<br />
Freight 17,234 15,349 16,289<br />
Travels 683 794 514<br />
Heating*** 15 11 186<br />
Electricity 3,648 3,453 2,760<br />
***Carbon emissions originate from burning of fuel oil. During<br />
<strong>2012</strong>, 1% of district heating at Insjön was based on fuel oil and<br />
99% on biomass. Of the carbon emissions, 5.7 tonnes comes<br />
from own consumption and 9.2 tonnes from district heating<br />
production.<br />
The performance<br />
indicators show energy<br />
consumption in four<br />
different areas: electricity<br />
consumption in stores,<br />
electricity consumption,<br />
district heating and oil<br />
consumption at the head<br />
office and distribution<br />
centre, and electricity<br />
consumption per delivered<br />
pallet.<br />
Carbon dioxide emissions from<br />
transport and travel<br />
Transport gram CO 2 per tonne/kilometre<br />
<strong>2012</strong> 2011 2010<br />
Outgoing freight 47.4 46.6 47.7<br />
Incoming freight - Europe 21.1 17.1 22.5<br />
Incoming freight - Asia 4.07 4.29 3.76<br />
Business travel gram CO 2 per person/kilometre<br />
<strong>2012</strong> 2011 2010<br />
Mean value road,air, rail 102 108 100<br />
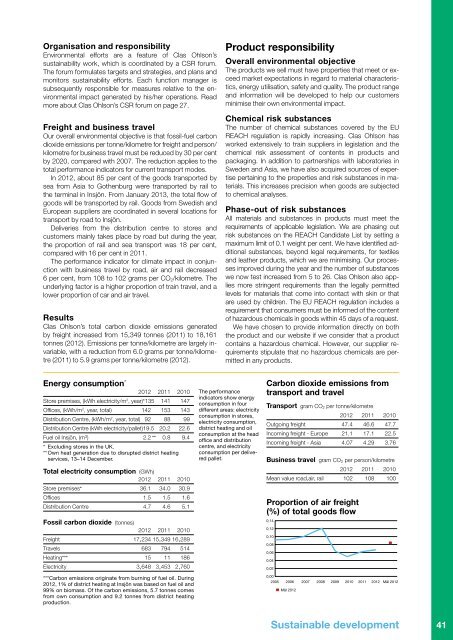
Proportion of air freight<br />
(%) of total goods flow<br />
0,14<br />
0,12<br />
0,10<br />
0,08<br />
0,06<br />
0,04<br />
0,02<br />
0,00<br />
2005 2006 2007 2008 2009 2010 2011 <strong>2012</strong> Mål <strong>2012</strong><br />
Mål <strong>2012</strong><br />
Sustainable development Sustainable development 41