Annual Report 2012/13 - Clas Ohlson
Annual Report 2012/13 - Clas Ohlson
Annual Report 2012/13 - Clas Ohlson

You also want an ePaper? Increase the reach of your titles
YUMPU automatically turns print PDFs into web optimized ePapers that Google loves.
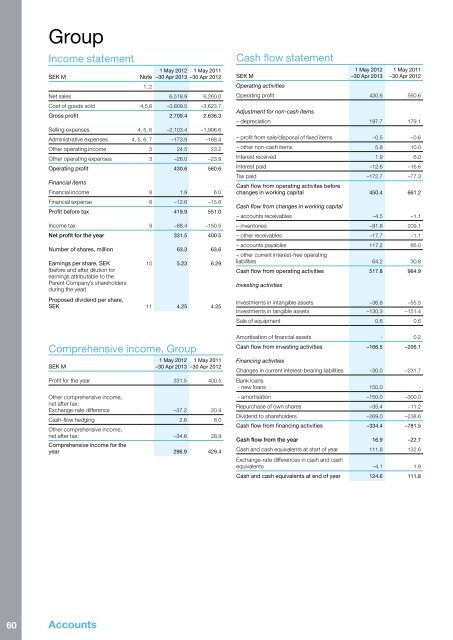
Group<br />
Income statement<br />
SEK M<br />
Note<br />
1, 2<br />
1 May <strong>2012</strong> 1 May 2011<br />
–30 Apr 20<strong>13</strong> –30 Apr <strong>2012</strong><br />
Net sales 6,518.9 6,260.0<br />
Cost of goods sold 4,5,6 –3,809.5 –3,623.7<br />
Gross profit 2,709.4 2,636.3<br />
Selling expenses 4, 5, 6 –2,103.4 –1,906.6<br />
Administrative expenses 4, 5, 6, 7 –173.9 –168.4<br />
Other operating income 3 24.5 23.2<br />
Other operating expenses 3 –26.0 –23.9<br />
Operating profit 430.6 560.6<br />
Financial items<br />
Financial income 8 1.9 6.0<br />
Financial expense 8 –12.6 –15.6<br />
Profit before tax 419.9 551.0<br />
Income tax 9 –88.4 –150.5<br />
Net profit for the year 331.5 400.5<br />
Number of shares, million 63.3 63.6<br />
Earnings per share, SEK 10 5.23 6.29<br />
(before and after dilution for<br />
earnings attributable to the<br />
Parent Company’s shareholders<br />
during the year)<br />
Proposed dividend per share,<br />
SEK 11 4.25 4.25<br />
Comprehensive income, Group<br />
SEK M<br />
1 May <strong>2012</strong> 1 May 2011<br />
–30 Apr 20<strong>13</strong> –30 Apr <strong>2012</strong><br />
Profit for the year 331.5 400.5<br />
Other comprehensive income,<br />
net after tax:<br />
Exchange-rate difference –37.2 20.9<br />
Cash-flow hedging 2.6 8.0<br />
Other comprehensive income,<br />
net after tax: –34.6 28.9<br />
Comprehensive income for the<br />
year 296.9 429.4<br />
Cash flow statement<br />
SEK M<br />
1 May <strong>2012</strong><br />
–30 Apr 20<strong>13</strong><br />
1 May 2011<br />
–30 Apr <strong>2012</strong><br />
Operating activities<br />
Operating profit 430.6 560.6<br />
Adjustment for non-cash items<br />
– depreciation 197.7 179.1<br />
– profit from sale/disposal of fixed items –0.5 –0.6<br />
– other non-cash items 5.8 10.0<br />
Interest received 1.9 6.0<br />
Interest paid –12.6 –16.6<br />
Tax paid –172.7 –77.3<br />
Cash flow from operating activites before<br />
changes in working capital 450.4 661.2<br />
Cash flow from changes in working capital<br />
– accounts receivables –4.5 –1.1<br />
– inventories –91.8 209.1<br />
– other receivables –17.7 –1.1<br />
– accounts payables 117.2 66.0<br />
– other current interest-free operating<br />
liabilities 64.2 30.8<br />
Cash flow from operating activities 517.8 964.9<br />
Investing activities<br />
Investments in intangible assets –36.8 –55.5<br />
Investments in tangible assets –<strong>13</strong>0.3 –151.4<br />
Sale of equipment 0.6 0.6<br />
Amortisation of financial assets - 0.2<br />
Cash flow from investing activities –166.5 –206.1<br />
Financing activities<br />
Changes in current interest-bearing liabilities –30.0 –231.7<br />
Bank loans<br />
- new loans 150.0 -<br />
- amortisation –150.0 –300.0<br />
Repurchase of own shares –35.4 –11.2<br />
Dividend to shareholders –269.0 –238.6<br />
Cash flow from financing activities –334.4 –781.5<br />
Cash flow from the year 16.9 –22.7<br />
Cash and cash equivalents at start of year 111.8 <strong>13</strong>2.6<br />
Exchange-rate differences in cash and cash<br />
equivalents –4.1 1.9<br />
Cash and cash equivalents at end of year 124.6 111.8<br />
60<br />
Accounts