Annual Report 2012/13 - Clas Ohlson
Annual Report 2012/13 - Clas Ohlson
Annual Report 2012/13 - Clas Ohlson

You also want an ePaper? Increase the reach of your titles
YUMPU automatically turns print PDFs into web optimized ePapers that Google loves.
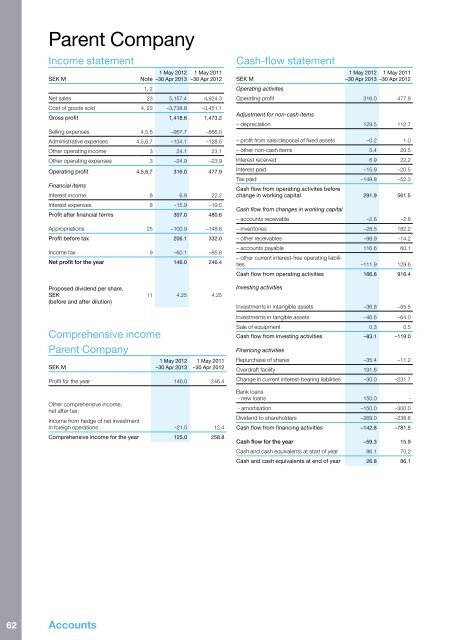
Parent Company<br />
Income statement<br />
SEK M<br />
Note<br />
1, 2<br />
1 May <strong>2012</strong><br />
–30 Apr 20<strong>13</strong><br />
1 May 2011<br />
–30 Apr <strong>2012</strong><br />
Net sales 23 5,157.4 4,924.3<br />
Cost of goods sold 4, 23 –3,738.8 –3,451.1<br />
Gross profit 1,418.6 1,473.2<br />
Selling expenses 4,5,6 –967.7 –866.0<br />
Administrative expenses 4,5,6,7 –<strong>13</strong>4.1 –128.5<br />
Other operating income 3 24.1 23.1<br />
Other operating expenses 3 –24.9 –23.9<br />
Operating profit 4,5,6,7 316.0 477.9<br />
Financial items<br />
Interest income 8 6.9 22.2<br />
Interest expenses 8 –15.9 –19.5<br />
Profit after financial terms 307.0 480.6<br />
Appropriations 25 –100.9 –148.6<br />
Profit before tax 206.1 332.0<br />
Income tax 9 –60.1 –85.6<br />
Net profit for the year 146.0 246.4<br />
Proposed dividend per share,<br />
SEK 11 4.25 4.25<br />
(before and after dilution)<br />
Comprehensive income<br />
Parent Company<br />
SEK M<br />
1 May <strong>2012</strong><br />
–30 Apr 20<strong>13</strong><br />
1 May 2011<br />
–30 Apr <strong>2012</strong><br />
Profit for the year 146.0 246.4<br />
Other comprehensive income,<br />
net after tax:<br />
Income from hedge of net investment<br />
in foreign operations –21.0 12.4<br />
Comprehensive income for the year 125.0 258.8<br />
Cash-flow statement<br />
1 May <strong>2012</strong> 1 May 2011<br />
SEK M<br />
–30 Apr 20<strong>13</strong> –30 Apr <strong>2012</strong><br />
Operating activites<br />
Operating profit 316.0 477.9<br />
Adjustment for non-cash items<br />
– depreciation 129.5 112.7<br />
– profit from sale/disposal of fixed assets –0.2 1.0<br />
– other non-cash items 5.4 20.5<br />
Interest received 6.9 22.2<br />
Interest paid –15.9 –20.5<br />
Tax paid –149.8 –52.3<br />
Cash flow from operating activites before<br />
change in working capital 291.9 561.5<br />
Cash flow from changes in working capital<br />
– accounts receivable –2.6 –2.8<br />
– inventories –28.5 182.2<br />
– other receivables –98.9 –14.2<br />
– accounts payable 116.6 60.1<br />
– other current interest-free operating liabilities<br />
–111.9 129.6<br />
Cash flow from operating activities 166.6 916.4<br />
Investing activities<br />
Investments in intangible assets –36.8 –55.5<br />
Investments in tangible assets –46.6 –64.0<br />
Sale of equipment 0.3 0.5<br />
Cash flow from investing activities –83.1 –119.0<br />
Financing activities<br />
Repurchase of shares –35.4 –11.2<br />
Overdraft facility 191.6 -<br />
Change in current interest-bearing liabilities –30.0 –231.7<br />
Bank loans<br />
- new loans 150.0 -<br />
- amortisation –150.0 –300.0<br />
Dividend to shareholders –269.0 –238.6<br />
Cash flow from financing activities –142.8 –781.5<br />
Cash flow for the year –59.3 15.9<br />
Cash and cash equivalents at start of year 86.1 70.2<br />
Cash and cash equivalents at end of year 26.8 86.1<br />
62<br />
Accounts