Annual Report 2012/13 - Clas Ohlson
Annual Report 2012/13 - Clas Ohlson
Annual Report 2012/13 - Clas Ohlson

You also want an ePaper? Increase the reach of your titles
YUMPU automatically turns print PDFs into web optimized ePapers that Google loves.
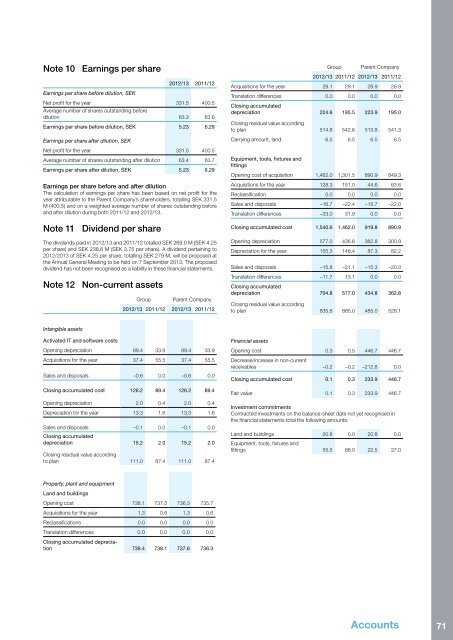
Note 10 Earnings per share<br />
Earnings per share before dilution, SEK<br />
<strong>2012</strong>/<strong>13</strong> 2011/12<br />
Net profit for the year 331.5 400.5<br />
Average number of shares outstanding before<br />
dilution 63.3 63.6<br />
Earnings per share before dilution, SEK 5.23 6.29<br />
Earnings per share after dilution, SEK<br />
Net profit for the year 331.5 400.5<br />
Average number of shares outstanding after dilution 63.4 63.7<br />
Earnings per share after dilution, SEK 5.23 6.29<br />
Earnings per share before and after dilution<br />
The calculation of earnings per share has been based on net profit for the<br />
year attributable to the Parent Company’s shareholders, totalling SEK 331.5<br />
M (400.5) and on a weighted average number of shares outstanding before<br />
and after dilution during both 2011/12 and <strong>2012</strong>/<strong>13</strong>.<br />
Note 11 Dividend per share<br />
The dividends paid in <strong>2012</strong>/<strong>13</strong> and 2011/12 totalled SEK 269.0 M (SEK 4.25<br />
per share) and SEK 238.6 M (SEK 3.75 per share). A dividend pertaining to<br />
<strong>2012</strong>/20<strong>13</strong> of SEK 4.25 per share, totalling SEK 279 M, will be proposed at<br />
the <strong>Annual</strong> General Meeting to be held on 7 September 20<strong>13</strong>. The proposed<br />
dividend has not been recognised as a liability in these financial statements.<br />
Note 12 Non-current assets<br />
Group<br />
Parent Company<br />
<strong>2012</strong>/<strong>13</strong> 2011/12 <strong>2012</strong>/<strong>13</strong> 2011/12<br />
Group<br />
Parent Company<br />
<strong>2012</strong>/<strong>13</strong> 2011/12 <strong>2012</strong>/<strong>13</strong> 2011/12<br />
Acquisitions for the year 29.1 29.1 28.9 28.9<br />
Translation differences 0.0 0.0 0.0 0.0<br />
Closing accumulated<br />
depreciation 224.6 195.5 223.9 195.0<br />
Closing residual value according<br />
to plan 514.8 542.6 5<strong>13</strong>.8 541.3<br />
Carrying amount, land 6.5 6.5 6.5 6.5<br />
Equipment, tools, fixtures and<br />
fittings<br />
Opening cost of acquisition 1,462.0 1,301.5 890.9 849.3<br />
Acquisitions for the year 128.3 151.0 44.6 63.6<br />
Reclassification 0.0 0.0 0.0 0.0<br />
Sales and disposals –16.7 –22.4 –15.7 –22.0<br />
Translation differences –33.0 31.9 0.0 0.0<br />
Closing accumulated cost 1,540.6 1,462.0 919.8 890.9<br />
Opening depreciation 577.0 436.6 362.8 300.9<br />
Depreciation for the year 155.3 148.4 87.3 82.2<br />
Sales and disposals –15.8 –21.1 –15.3 –20.3<br />
Translation differences –11.7 <strong>13</strong>.1 0.0 0.0<br />
Closing accumulated<br />
depreciation 704.8 577.0 434.8 362.8<br />
Closing residual value according<br />
to plan 835.8 885.0 485.0 528.1<br />
Intangible assets<br />
Activated IT and software costs<br />
Opening depreciation 89.4 33.9 89.4 33.9<br />
Acquisitions for the year 37.4 55.5 37.4 55.5<br />
Sales and disposals –0.6 0.0 –0.6 0.0<br />
Closing accumulated cost 126.2 89.4 126.2 89.4<br />
Opening depreciation 2.0 0.4 2.0 0.4<br />
Depreciation for the year <strong>13</strong>.3 1.6 <strong>13</strong>.3 1.6<br />
Sales and disposals –0.1 0.0 –0.1 0.0<br />
Closing accumulated<br />
depreciation 15.2 2.0 15.2 2.0<br />
Closing residual value according<br />
to plan 111.0 87.4 111.0 87.4<br />
Financial assets<br />
Opening cost 0.3 0.5 446.7 446.7<br />
Decrease/increase in non-current<br />
receivables –0.2 –0.2 –212.8 0.0<br />
Closing accumulated cost 0.1 0.3 233.9 446.7<br />
Fair value 0.1 0.3 233.9 446.7<br />
Investment commitments<br />
Contracted investments on the balance-sheet date not yet recognised in<br />
the financial statements total the following amounts:<br />
Land and buildings 20.8 0.0 20.8 0.0<br />
Equipment, tools, fixtures and<br />
fittings 55.5 88.0 22.5 27.0<br />
Property, plant and equipment<br />
Land and buildings<br />
Opening cost 738.1 737.5 736.3 735.7<br />
Acquisitions for the year 1.3 0.6 1.3 0.6<br />
Reclassifications 0.0 0.0 0.0 0.0<br />
Translation differences 0.0 0.0 0.0 0.0<br />
Closing accumulated depreciation<br />
739.4 738.1 737.6 736.3<br />
Accounts 71