Annual Report 2012/13 - Clas Ohlson
Annual Report 2012/13 - Clas Ohlson
Annual Report 2012/13 - Clas Ohlson

You also want an ePaper? Increase the reach of your titles
YUMPU automatically turns print PDFs into web optimized ePapers that Google loves.
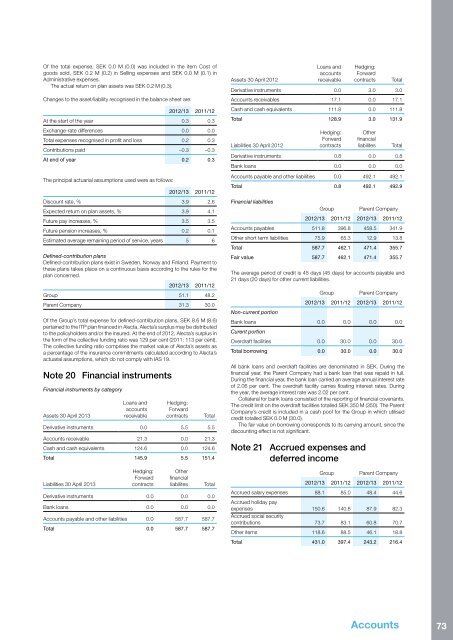
Of the total expense, SEK 0.0 M (0.0) was included in the item Cost of<br />
goods sold, SEK 0.2 M (0.2) in Selling expenses and SEK 0.0 M (0.1) in<br />
Administrative expenses.<br />
The actual return on plan assets was SEK 0.2 M (0.3).<br />
Changes to the asset/liability recognised in the balance sheet are:<br />
<strong>2012</strong>/<strong>13</strong> 2011/12<br />
At the start of the year 0.3 0.3<br />
Exchange-rate differences 0.0 0.0<br />
Total expenses recognised in profit and loss 0.2 0.3<br />
Contributions paid –0.3 –0.3<br />
At end of year 0.2 0.3<br />
The principal actuarial assumptions used were as follows:<br />
<strong>2012</strong>/<strong>13</strong> 2011/12<br />
Discount rate, % 3.9 2.6<br />
Expected return on plan assets, % 3.9 4.1<br />
Future pay increases, % 3.5 3.5<br />
Future pension increases, % 0.2 0.1<br />
Estimated average remaining period of service, years 5 6<br />
Defined-contribution plans<br />
Defined-contribution plans exist in Sweden, Norway and Finland. Payment to<br />
these plans takes place on a continuous basis according to the rules for the<br />
plan concerned.<br />
<strong>2012</strong>/<strong>13</strong> 2011/12<br />
Group 51.1 48.2<br />
Parent Company 31.3 30.0<br />
Of the Group’s total expense for defined-contribution plans, SEK 8.6 M (8.6)<br />
pertained to the ITP plan financed in Alecta. Alecta’s surplus may be distributed<br />
to the policyholders and/or the insured. At the end of <strong>2012</strong>, Alecta’s surplus in<br />
the form of the collective funding ratio was 129 per cent (2011: 1<strong>13</strong> per cent).<br />
The collective funding ratio comprises the market value of Alecta’s assets as<br />
a percentage of the insurance commitments calculated according to Alecta’s<br />
actuarial assumptions, which do not comply with IAS 19.<br />
Note 20 Financial instruments<br />
Financial instruments by category<br />
Assets 30 April 20<strong>13</strong><br />
Loans and<br />
accounts<br />
receivable<br />
Hedging:<br />
Forward<br />
contracts<br />
Total<br />
Derivative instruments 0.0 5.5 5.5<br />
Accounts receivable 21.3 0.0 21.3<br />
Cash and cash equivalents 124.6 0.0 124.6<br />
Total 145.9 5.5 151.4<br />
Liabilities 30 April 20<strong>13</strong><br />
Hedging:<br />
Forward<br />
contracts<br />
Other<br />
financial<br />
liabilites<br />
Total<br />
Derivative instruments 0.0 0.0 0.0<br />
Bank loans 0.0 0.0 0.0<br />
Accounts payable and other liabilities 0.0 587.7 587.7<br />
Total 0.0 587.7 587.7<br />
Assets 30 April <strong>2012</strong><br />
Loans and<br />
accounts<br />
receivable<br />
Hedging:<br />
Forward<br />
contracts<br />
Total<br />
Derivative instruments 0.0 3.0 3.0<br />
Accounts receivables 17.1 0.0 17.1<br />
Cash and cash equivalents 111.8 0.0 111.8<br />
Total 128.9 3.0 <strong>13</strong>1.9<br />
Liabilities 30 April <strong>2012</strong><br />
Hedging:<br />
Forward<br />
contracts<br />
Other<br />
financial<br />
liabilites<br />
Total<br />
Derivative instruments 0.8 0.0 0.8<br />
Bank loans 0.0 0.0 0.0<br />
Accounts payable and other liabilities 0.0 492.1 492.1<br />
Total 0.8 492.1 492.9<br />
Financial liabilities<br />
Group<br />
Parent Company<br />
<strong>2012</strong>/<strong>13</strong> 2011/12 <strong>2012</strong>/<strong>13</strong> 2011/12<br />
Accounts payables 511.8 396.8 458.5 341.9<br />
Other short term liabilities 75.9 65.3 12.9 <strong>13</strong>.8<br />
Total 587.7 462.1 471.4 355.7<br />
Fair value 587.7 462.1 471.4 355.7<br />
The average period of credit is 45 days (45 days) for accounts payable and<br />
21 days (20 days) for other current liabilities.<br />
Non-current portion<br />
Group<br />
Parent Company<br />
<strong>2012</strong>/<strong>13</strong> 2011/12 <strong>2012</strong>/<strong>13</strong> 2011/12<br />
Bank loans 0.0 0.0 0.0 0.0<br />
Curent portion<br />
Overdraft facilities 0.0 30.0 0.0 30.0<br />
Total borrowing 0.0 30.0 0.0 30.0<br />
All bank loans and overdraft facilities are denominated in SEK. During the<br />
financial year, the Parent Company had a bank loan that was repaid in full.<br />
During the financial year, the bank loan carried an average annual interest rate<br />
of 2.06 per cent. The overdraft facility carries floating interest rates. During<br />
the year, the average interest rate was 2.02 per cent.<br />
Collateral for bank loans consisted of the reporting of financial covenants.<br />
The credit limit on the overdraft facilities totalled SEK 350 M (350). The Parent<br />
Company’s credit is included in a cash pool for the Group in which utilised<br />
credit totalled SEK 0.0 M (30.0).<br />
The fair value on borrowing corresponds to its carrying amount, since the<br />
discounting effect is not significant.<br />
Note 21 Accrued expenses and<br />
deferred income<br />
Group<br />
Parent Company<br />
<strong>2012</strong>/<strong>13</strong> 2011/12 <strong>2012</strong>/<strong>13</strong> 2011/12<br />
Accrued salary expenses 88.1 85.0 48.4 44.6<br />
Accrued holiday pay<br />
expenses 150.6 140.8 87.9 82.3<br />
Accrued social security<br />
contributions 73.7 83.1 60.8 70.7<br />
Other items 118.6 88.5 46.1 18.8<br />
Total 431.0 397.4 243.2 216.4<br />
Accounts 73