May/June 2013 - The ASIA Miner
May/June 2013 - The ASIA Miner
May/June 2013 - The ASIA Miner

Create successful ePaper yourself
Turn your PDF publications into a flip-book with our unique Google optimized e-Paper software.
International Project Survey<br />
<strong>The</strong> number of projects at the feasibility stage has increased strongly,<br />
to 28% of total investment. This growth is to be expected given the high<br />
numbers of new projects announced in 2010 and 2011, which now<br />
have matured and evolved to the next stage in the development<br />
process. At the same time, the number of projects at the conceptual<br />
and pre-feasibility stages has decreased because of a drop in new, earlystage<br />
projects, reflecting the declining investment appetite and increasing<br />
financial problems of the junior companies that initiate most of these<br />
projects. This will likely cause some problems in the future, as there will<br />
not be enough conceptual- or prefeasibility-stage projects in the pipeline<br />
to meet the inevitable rising demand for metal.<br />
<strong>The</strong> share of projects at the construction stage increased marginally<br />
compared with 2011. However, the investment value of this sector<br />
grew strongly in 2012. <strong>The</strong> average cost of projects under<br />
construction in 2012 was $930 million—a large difference from the<br />
average of $645 million in 2011. <strong>The</strong> same situation is noticeable for<br />
brownfield projects, although for those the average project cost is<br />
generally much lower, at $450 million, than for a greenfield project.<br />
It is difficult to accurately monitor the progress of brownfield projects<br />
from project studies to construction because they are often carried<br />
out internally and quickly, without public disclosure. Thus, the total investment<br />
figure for projects under construction is undoubtedly an underestimate,<br />
particularly for this project category.<br />
All of this year’s survey statistics are based on projects with an announced<br />
investment estimate. <strong>The</strong> RMD Metals database also includes<br />
approximately 1,900 projects—mostly in the conceptual<br />
stage—for which no investment figure has been announced. <strong>The</strong> investment<br />
total for all mining projects, including projects for which no<br />
investment estimate has been published, is therefore larger than the<br />
$735 billion recorded at the end of 2011—but it is difficult to estimate<br />
how much larger. If it is assumed that the projects without published<br />
investment estimates have a similar cost structure to those projects<br />
whose costs are known, the total figure would increase considerably.<br />
It could, however, also be argued that unannounced-project costs are<br />
lower, as most mega-projects are conducted by public companies<br />
that must publicly disclose all significant expenditures. If this is indeed<br />
the case, the total figure would be smaller. Projects involving metals<br />
not covered in this survey but included in the database also represent<br />
a specific investment total but one that is estimated at a much<br />
lower level than the major metals represented in the survey<br />
Given the continued strong metal demand from China, India and<br />
other emerging economies, RMG expects metal prices to mildly decline<br />
in <strong>2013</strong> before possibly rising again in 2014.<br />
Many of the early stage projects included in this year’s total investment<br />
figure will not pass from the conceptual study phase to the construction<br />
stage for a number of reasons. However, historically RMG<br />
has observed that 60%–75% of all projects announced will materialize<br />
during a three-year period.<br />
Iron Ore Grabs a Bigger Share<br />
As in previous years iron ore, copper, gold and nickel, in that order, are<br />
the largest investment targets for mining companies. <strong>The</strong>se four metals<br />
account for 86% of the total project pipeline, a small increase from<br />
84% in 2011. <strong>The</strong>y also dominate the mining business in terms of<br />
total value of its output, which for these metals only is $606 billion or<br />
71% of the total value of all mine production of metals during 2011.<br />
Iron ore project investment remains firmly in the top spot, as it has<br />
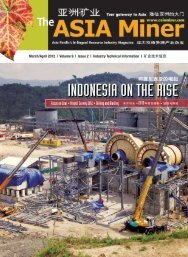
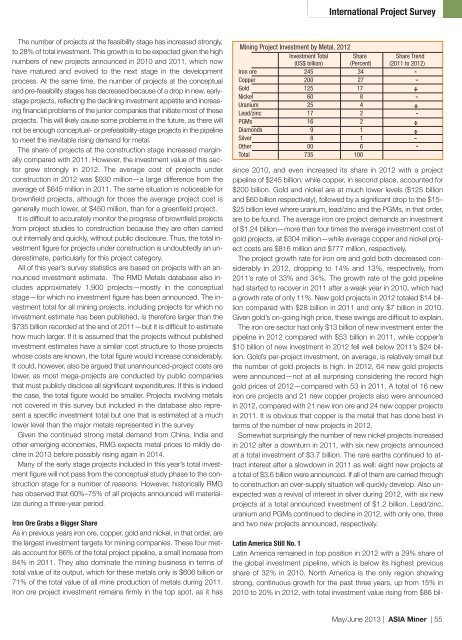
Mining Project Investment by Metal, 2012<br />
Investment Total Share Share Trend<br />
(US$ billion) (Percent) (2011 to 2012)<br />
Iron ore 245 034<br />
Copper 200 027<br />
Gold 125 017<br />
÷<br />
Nickel 60 008<br />
Uranium 25 004<br />
÷<br />
Lead/zinc 17 002<br />
PGMs 16 002<br />
÷<br />
Diamonds 9 001<br />
÷<br />
Silver 8 001<br />
Other 00 006<br />
Total 735 100<br />
since 2010, and even increased its share in 2012 with a project<br />
pipeline of $245 billion; while copper, in second place, accounted for<br />
$200 billion. Gold and nickel are at much lower levels ($125 billion<br />
and $60 billion respectively), followed by a significant drop to the $15–<br />
$25 billion level where uranium, lead/zinc and the PGMs, in that order,<br />
are to be found. <strong>The</strong> average iron ore project demands an investment<br />
of $1.24 billion—more than four times the average investment cost of<br />
gold projects, at $304 million—while average copper and nickel project<br />
costs are $816 million and $777 million, respectively.<br />
<strong>The</strong> project growth rate for iron ore and gold both decreased considerably<br />
in 2012, dropping to 14% and 13%, respectively, from<br />
2011’s rate of 33% and 34%. <strong>The</strong> growth rate of the gold pipeline<br />
had started to recover in 2011 after a weak year in 2010, which had<br />
a growth rate of only 11%. New gold projects in 2012 totaled $14 billion<br />
compared with $28 billion in 2011 and only $7 billion in 2010.<br />
Given gold’s on-going high price, these swings are difficult to explain.<br />
<strong>The</strong> iron ore sector had only $13 billion of new investment enter the<br />
pipeline in 2012 compared with $53 billion in 2011, while copper’s<br />
$10 billion of new investment in 2012 fell well below 2011’s $24 billion.<br />
Gold’s per-project investment, on average, is relatively small but<br />
the number of gold projects is high. In 2012, 64 new gold projects<br />
were announced—not at all surprising considering the record high<br />
gold prices of 2012—compared with 53 in 2011. A total of 16 new<br />
iron ore projects and 21 new copper projects also were announced<br />
in 2012, compared with 21 new iron ore and 24 new copper projects<br />
in 2011. It is obvious that copper is the metal that has done best in<br />
terms of the number of new projects in 2012.<br />
Somewhat surprisingly the number of new nickel projects increased<br />
in 2012 after a downturn in 2011, with six new projects announced<br />
at a total investment of $3.7 billion. <strong>The</strong> rare earths continued to attract<br />
interest after a slowdown in 2011 as well: eight new projects at<br />
a total of $3.6 billion were announced. If all of them are carried through<br />
to construction an over-supply situation will quickly develop. Also unexpected<br />
was a revival of interest in silver during 2012, with six new<br />
projects at a total announced investment of $1.2 billion. Lead/zinc,<br />
uranium and PGMs continued to decline in 2012, with only one, three<br />
and two new projects announced, respectively.<br />
Latin America Still No. 1<br />
Latin America remained in top position in 2012 with a 29% share of<br />
the global investment pipeline, which is below its highest previous<br />
share of 32% in 2010. North America is the only region showing<br />
strong, continuous growth for the past three years, up from 15% in<br />
2010 to 20% in 2012, with total investment value rising from $86 bil-<br />
’ ’<br />
’ ’ ’ ’<br />
<strong>May</strong>/<strong>June</strong> <strong>2013</strong> | <strong>ASIA</strong> <strong>Miner</strong> | 55