May/June 2013 - The ASIA Miner
May/June 2013 - The ASIA Miner
May/June 2013 - The ASIA Miner

Create successful ePaper yourself
Turn your PDF publications into a flip-book with our unique Google optimized e-Paper software.
International Project Survey<br />
lion in 2010 to $146 billion in 2012. Africa’s share of total mining project<br />
investment was down slightly to 14%, but increased in value to<br />
$106 billion. Europe, including all of Russia, maintained its position<br />
but Asia’s share fell from 11% to 10%; Asia reached its peak of 14%<br />
in 2009 but has been falling since.<br />
<strong>The</strong> investment pipeline in North America grew by $24 billion in<br />
2012, and in Oceania by $8 billion, a considerably slower pace than<br />
the previous year. Latin America’s project pipeline shows the highest<br />
average of all because there are more super large projects in this region<br />
than in any of the others. <strong>The</strong> average project investment within<br />
the Latin America sector is $730 million, more than twice Asia’s average<br />
of $363 million. <strong>The</strong> other regions fall between these two extremes:<br />
Europe, $450 million; Africa, $541 million; North America,<br />
$681 million; and Oceania, $583 million, respectively.<br />
In Europe (excluding Russia), focus is increasingly on the Nordic countries,<br />
including Finland, Sweden and Greenland. Sweden has maintained<br />
its position among the top 20 countries. Finland is likely to move up the<br />
list, as Anglo American has announced that its Sakatti<br />
copper/nickel/PGM early-stage project is among the most promising<br />
greenfield finds made by the company globally in 20 years. In addition,<br />
Gold Fields has revitalized its Arctic platinum project in northern Finland.<br />
<strong>The</strong> European Commission’s renewed interest in the mining sector<br />
has not resulted in any notable improvements in Europe’s investment<br />
climate, despite the Raw Materials Initiative having been in place for<br />
several years. In Africa, the African Union has decided to establish<br />
the Africa <strong>Miner</strong>al Development Center in Addis Ababa, the capital<br />
city of Ethiopia, to support the implementation of the African Mining<br />
Vision. <strong>The</strong> World Bank has announced plans to spend $1 billion on<br />
mapping and exploration for metals and minerals in Africa, which<br />
would give this underexplored region a boost. Asia’s problems are<br />
clearly highlighted by the continuing uncertainty surrounding Mongolia’s<br />
Oyu Tolgoi copper project, which has been delayed several times<br />
due to the government’s on-going insistence on renegotiating the project’s<br />
mine agreement.<br />
Investors Wary of Resource Nationalism,<br />
Unstable Environments<br />
<strong>The</strong> total investment pipeline share of the 10 most attractive countries<br />
was static in 2012 at 71%, identical to 2011. Australia and<br />
Canada continue to dominate both in terms of capex volumes and<br />
number of projects. Together, they account for more than $200 billion,<br />
divided among 326 projects.<br />
Although the promise of “spreading mining investments more evenly<br />
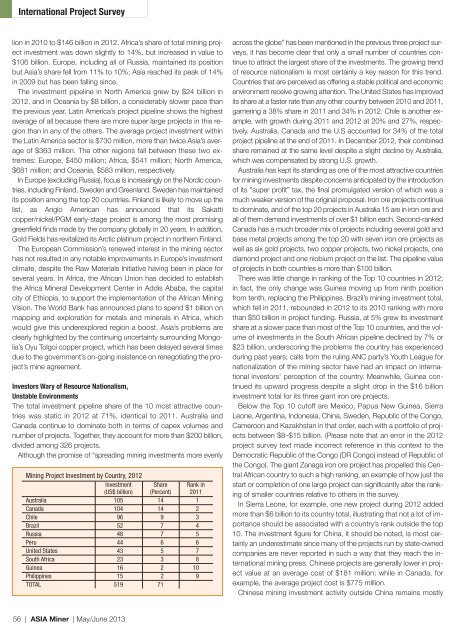
Mining Project Investment by Country, 2012<br />
Investment Share Rank in<br />
(US$ billion) (Percent) 2011<br />
Australia 105 14 01<br />
Canada 104 14 02<br />
Chile 096 09 03<br />
Brazil 052 07 04<br />
Russia 048 07 05<br />
Peru 044 06 06<br />
United States 043 05 07<br />
South Africa 023 03 08<br />
Guinea 016 02 10<br />
Philippines 015 02 09<br />
TOTAL 519 71<br />
across the globe” has been mentioned in the previous three project surveys,<br />
it has become clear that only a small number of countries continue<br />
to attract the largest share of the investments. <strong>The</strong> growing trend<br />
of resource nationalism is most certainly a key reason for this trend.<br />
Countries that are perceived as offering a stable political and economic<br />
environment receive growing attention. <strong>The</strong> United States has improved<br />
its share at a faster rate than any other country between 2010 and 2011,<br />
garnering a 38% share in 2011 and 34% in 2012. Chile is another example,<br />
with growth during 2011 and 2012 at 20% and 27%, respectively.<br />
Australia, Canada and the U.S accounted for 34% of the total<br />
project pipeline at the end of 2011. In December 2012, their combined<br />
share remained at the same level despite a slight decline by Australia,<br />
which was compensated by strong U.S. growth.<br />
Australia has kept its standing as one of the most attractive countries<br />
for mining investments despite concerns anticipated by the introduction<br />
of its ”super profit” tax, the final promulgated version of which was a<br />
much weaker version of the original proposal. Iron ore projects continue<br />
to dominate, and of the top 20 projects in Australia 15 are in iron ore and<br />
all of them demand investments of over $1 billion each. Second-ranked<br />
Canada has a much broader mix of projects including several gold and<br />
base metal projects among the top 20 with seven iron ore projects as<br />
well as six gold projects, two copper projects, two nickel projects, one<br />
diamond project and one niobium project on the list. <strong>The</strong> pipeline value<br />
of projects in both countries is more than $100 billion.<br />
<strong>The</strong>re was little change in ranking of the Top 10 countries in 2012;<br />
in fact, the only change was Guinea moving up from ninth position<br />
from tenth, replacing the Philippines. Brazil’s mining investment total,<br />
which fell in 2011, rebounded in 2012 to its 2010 ranking with more<br />
than $50 billion in project funding. Russia, at 5% grew its investment<br />
share at a slower pace than most of the Top 10 countries, and the volume<br />
of investments in the South African pipeline declined by 7% or<br />
$23 billion, underscoring the problems the country has experienced<br />
during past years; calls from the ruling ANC party’s Youth League for<br />
nationalization of the mining sector have had an impact on international<br />
investors’ perception of the country. Meanwhile, Guinea continued<br />
its upward progress despite a slight drop in the $16 billion<br />
investment total for its three giant iron ore projects.<br />
Below the Top 10 cutoff are Mexico, Papua New Guinea, Sierra<br />
Leone, Argentina, Indonesia, China, Sweden, Republic of the Congo,<br />
Cameroon and Kazakhstan in that order, each with a portfolio of projects<br />
between $8–$15 billion. (Please note that an error in the 2012<br />
project survey text made incorrect reference in this context to the<br />
Democratic Republic of the Congo (DR Congo) instead of Republic of<br />
the Congo). <strong>The</strong> giant Zanaga iron ore project has propelled this Central<br />
African country to such a high ranking, an example of how just the<br />
start or completion of one large project can significantly alter the ranking<br />
of smaller countries relative to others in the survey.<br />
In Sierra Leone, for example, one new project during 2012 added<br />
more than $6 billion to its country total, illustrating that not a lot of importance<br />
should be associated with a country’s rank outside the top<br />
10. <strong>The</strong> investment figure for China, it should be noted, is most certainly<br />
an underestimate since many of the projects run by state-owned<br />
companies are never reported in such a way that they reach the international<br />
mining press. Chinese projects are generally lower in project<br />
value at an average cost of $181 million; while in Canada, for<br />
example, the average project cost is $775 million.<br />
Chinese mining investment activity outside China remains mostly<br />
56 | <strong>ASIA</strong> <strong>Miner</strong> | <strong>May</strong>/<strong>June</strong> <strong>2013</strong>