

ConflictBarometer_2012
ConflictBarometer_2012
ConflictBarometer_2012

Create successful ePaper yourself
Turn your PDF publications into a flip-book with our unique Google optimized e-Paper software.
Global Conflict Panorama<br />
The average intensity calculated for all domestic conflicts<br />
observed (2.63) was approx. one intensity level higher than<br />
that of interstate conflicts (1.57). Apart from the higher mean<br />
intensity, intrastate conflicts also preserved a higher total<br />
number of conflicts since the beginning of the long-term analysis<br />
of conflicts in 1945. The same long-term observation period,<br />
for which purpose both limited wars and wars were compiled<br />
in one group of high intensity conflicts, clearly shows<br />
that the intrastate dominance among the highly violent conflicts<br />
sustained.<br />
Regional Development<br />
Similar to previous years, Asia and Oceania ranked highest with<br />
128 conflicts, accounting for about one third of all conflicts observed.<br />
These were followed by Sub-Saharan Africa with 90, the<br />
Middle East and Maghreb with 69, Europe with 58, and the Americas<br />
with 51. In terms of highly-violent conflicts, Sub-Saharan<br />
Africa brought forth nineteen conflicts of the corresponding intensity,<br />
while ten were counted in Asia and Oceania, and nine in<br />
the Middle East and Maghreb. Accordingly, Sub-Saharan Africa<br />
had the most wars (nine). Europe and the Americas experienced<br />
no changes in the number of highly violent conflicts compared<br />
to 2011, counting one and three limited wars respectively, as<br />
well as one war in the Americas [1 Mexico (drug cartels)]. The<br />
sum of highly violent conflicts decreased in the Middle East and<br />
Maghreb (from thirteen to nine), marking the only decrease. Meanwhile,<br />
the regions of Sub-Saharan Africa as well as Asia and<br />
Oceania saw a rise in high intensity conflicts, with an increase<br />
by six and two, respectively. In Asia and Oceania, 55 violent crises<br />
were observed, followed by Sub-Saharan Africa with 37 and<br />
the Middle East and Maghreb with 36. Concerning non-violent<br />
conflicts, 63 have been listed in Asia and Oceania, pursued by<br />
Europe with the second largest occurrence of non-violent conflicts<br />
(45).<br />
Asia and Oceania accounted for 34 percent of all intrastate<br />
conflicts and 26 percent of all interstate conflicts observed. Regarding<br />
intrastate conflicts, the regions ranked as follows: Sub-<br />
Saharan Africa (24 percent), Middle East and Maghreb (18 percent),<br />
Europe, and the Americas (both 12 percent). Considering<br />
interstate conflicts, Europe came second with 23 percent, followed<br />
by the Americas with eighteen percent and Sub-Saharan<br />
Africa as well as the Middle East and Maghreb (both 17 percent).<br />
Relating the number of conflicts to the number of countries in a<br />
region, the Middle East and Maghreb has shown to be the most<br />
conflict-ridden, with a general average value of 3.2, and specifically<br />
for highly violent conflicts with 0.4 per state. Asia and Oceania<br />
ranked second regarding the overall average and third for<br />
highly violent conflicts (2.8 and 0.2 respectively). Sub-Saharan<br />
Africa was situated third with an overall average per state of 1.9,<br />
while sharing the first rank for highly violent conflicts with 0.4.<br />
This calculation underlines that the Americas and Europe were<br />
the most peaceful regions this year, in ascending order.<br />
1<br />
12<br />
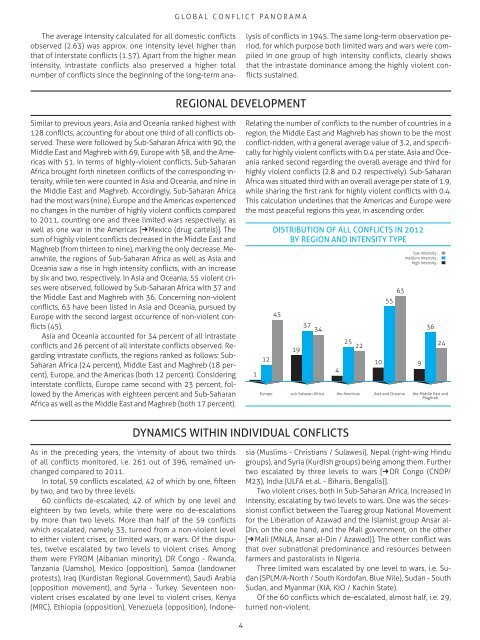
Distribution of all Conflicts in <strong>2012</strong><br />
by Region and Intensity Type<br />
45<br />
19<br />
37<br />
34<br />
4<br />
25<br />
22<br />
low Intensity :<br />
medium Intensity :<br />
high Intensity :<br />
Europe sub-Saharan Africa the Americas Asia and Oceania the Middle East and<br />
Maghreb<br />
10<br />
63<br />
55<br />
9<br />
36<br />
24<br />
Dynamics within individual conflicts<br />
As in the preceding years, the intensity of about two thirds<br />
of all conflicts monitored, i.e. 261 out of 396, remained unchanged<br />
compared to 2011.<br />
In total, 59 conflicts escalated, 42 of which by one, fifteen<br />
by two, and two by three levels.<br />
60 conflicts de-escalated, 42 of which by one level and<br />
eighteen by two levels, while there were no de-escalations<br />
by more than two levels. More than half of the 59 conflicts<br />
which escalated, namely 33, turned from a non-violent level<br />
to either violent crises, or limited wars, or wars. Of the disputes,<br />
twelve escalated by two levels to violent crises. Among<br />
them were FYROM (Albanian minority), DR Congo - Rwanda,<br />
Tanzania (Uamsho), Mexico (opposition), Samoa (landowner<br />
protests), Iraq (Kurdistan Regional Government), Saudi Arabia<br />
(opposition movement), and Syria - Turkey. Seventeen nonviolent<br />
crises escalated by one level to violent crises, Kenya<br />
(MRC), Ethiopia (opposition), Venezuela (opposition), Indonesia<br />
(Muslims - Christians / Sulawesi), Nepal (right-wing Hindu<br />
groups), and Syria (Kurdish groups) being among them. Further<br />
two escalated by three levels to wars [1 DR Congo (CNDP/<br />
M23), India (ULFA et al. - Biharis, Bengalis)].<br />
Two violent crises, both in Sub-Saharan Africa, increased in<br />
intensity, escalating by two levels to wars. One was the secessionist<br />
conflict between the Tuareg group National Movement<br />
for the Liberation of Azawad and the Islamist group Ansar al-<br />
Din, on the one hand, and the Mali government, on the other<br />
[1 Mali (MNLA, Ansar al-Din / Azawad)]. The other conflict was<br />
that over subnational predominance and resources between<br />
farmers and pastoralists in Nigeria.<br />
Three limited wars escalated by one level to wars, i.e. Sudan<br />
(SPLM/A-North / South Kordofan, Blue Nile), Sudan - South<br />
Sudan, and Myanmar (KIA, KIO / Kachin State).<br />
Of the 60 conflicts which de-escalated, almost half, i.e. 29,<br />
turned non-violent.<br />
4