Vehicle Crashworthiness and Occupant Protection - Chapter 3
Vehicle Crashworthiness and Occupant Protection - Chapter 3
Vehicle Crashworthiness and Occupant Protection - Chapter 3

You also want an ePaper? Increase the reach of your titles
YUMPU automatically turns print PDFs into web optimized ePapers that Google loves.
Finite Element Analytical Techniques<br />
<strong>and</strong> Applications to Structural Design<br />
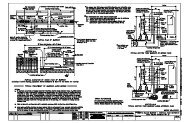
Fig. 3.6.1.1 Rail test set-up<br />
3.6.1 Component Models<br />
Component models can be grouped into generic components such as S-rails <strong>and</strong><br />
rectangular tubes, <strong>and</strong> actual isolated components such as upper rails, lower rails<br />
<strong>and</strong> hoods. These components are typically tested in both quasi-static <strong>and</strong><br />
dynamic modes to identify their crush performance. In dynamic testing, a dropsilo<br />
or a sled is used. In drop-silo testing, the component is fixed to the ground<br />
on a load cell <strong>and</strong> loading is typically applied from the gravitational fall of a rigid<br />
mass onto the free end of the component. In sled testing of components, the<br />
component is mounted horizontally onto the sled (Figure 3.6.1.1) which<br />
subsequently is launched to impact a rigid or deformable surface with the<br />
component making first contact. Figure 3.6.1.2 shows the S-rail final deformations<br />
corresponding to initial impact speeds of 2, 4.5 <strong>and</strong> 8.2 m/s into a rigid wall. The<br />
rail deformations exhibited two plastic hinges at the rail curvatures, rotation at<br />
the free end <strong>and</strong> plastic hinge at the fixed end. The measured peak force increased<br />
with impact speed from about 50 to 60 kPa, due to strain rate effects of the material<br />
used. The FE simulation corresponding to 8.2 m/s impact agreed quite well with<br />
the test result when the strain rate effects were included in the simulation.<br />
Increasing the number of shell elements from 2,000 to 3,000 showed minor influence<br />
on the overall response.<br />
The deformed mid-rail shapes of an actual passenger car mid-rail are shown in<br />
Figure 3.6.1.3, corresponding to test speeds of 2.2, 4.4 <strong>and</strong> 6.7 m/s, respectively<br />
[40]. In Figure 3.6.1.4 the FE predictions of the force-time pulse show good a<br />
Page 137