Modeling of Lithium-Ion Battery for Energy Storage System Simulation
Modeling of Lithium-Ion Battery for Energy Storage System Simulation
Modeling of Lithium-Ion Battery for Energy Storage System Simulation

Create successful ePaper yourself
Turn your PDF publications into a flip-book with our unique Google optimized e-Paper software.
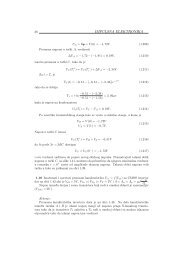
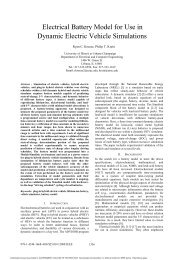
In (10), rk is the coefficient <strong>of</strong> the kth order term in the<br />
polynomial representation <strong>of</strong> R2_ref. SOD selected is less than<br />
the SOD level at the termination <strong>of</strong> discharge. The terminal<br />
SOD chosen in this paper is 0.7. Then the correction term is<br />
i* R ( T)<br />
2<br />
α ( T ) =<br />
(11)<br />
i* R2_ref<br />
From (9)-(11), R2 <strong>of</strong> the internal resistance can be expressed as<br />
n<br />
k<br />
R = α ( T) * r * SOD [ i( t), t]<br />
(12)<br />
2 � k<br />
k = 0<br />
Fig. 4. R2_ref <strong>for</strong> the lithium-ion battery based on the 25�and -<br />
20� curves.<br />
C. Description <strong>of</strong> the Thermal Characteristics<br />
Since E is temperature dependent, temperature must be<br />
calculated dynamically so that it is available <strong>for</strong> computation <strong>of</strong><br />
E during each time step [6]. The temperature change <strong>of</strong> the<br />
battery is governed by the thermal energy balance [7] described<br />
by�<br />
dT () t<br />
2<br />
m* c * = i() t *( R + R ) −h A[ T() t −T<br />
] (13)<br />
p 1 2 c a<br />
dt<br />
In (13), m is the battery mass (in kg), cp is the specific heat<br />
(J/kg/K), hc is the heat transfer coefficient (W/m 2 ), A is the<br />
battery external surface area (m 2 ), Tc is the ambient<br />
temperature.<br />
The heat power terms include resistive heating and heat<br />
exchange to the surroundings. Heat generation due to entropy<br />
change or phase change, changes in the heat capacity and<br />
mixing have all been ignored here because from [5], it has been<br />
concluded that such omission will not cause significant loss <strong>of</strong><br />
model accuracy.<br />
D. Implementation based on the VHDL model in<br />
SIMPLORER<br />
Equations (1)-(4), (8), (12) and (13) provide complete<br />
description <strong>of</strong> the battery. From the derived mathematical<br />
model, the model can be simulated using VHDL-AMS method<br />
in SIMPLORER [8]. Un<strong>for</strong>tunately, lifecycle has not been<br />
considered in the battery model implementation since there is<br />
insufficient experimental data at the time <strong>of</strong> the writing <strong>of</strong> this<br />
paper.<br />
III. COMPARISON OF SIMULATION AND TEST RESULTS<br />
A. Discharge Characteristics<br />
A dynamic model <strong>of</strong> the ULTRALIFE UBBL10 lithiumion<br />
battery on the methodology given above was constructed<br />
<strong>for</strong> use in the SIMPLORER s<strong>of</strong>tware. The parameters are<br />
given in TABLE 1.<br />
The rate dependence <strong>of</strong> potential was validated by testing<br />
the Ultralife UBBL10 lithium-ion VHDL model. The initial<br />
SOD is set to 0. The battery is maintained at room temperature<br />
(25° C) by setting a large cooling coefficient (hc = 100 W/m 2<br />
K). This simulates the idealized constant-temperature case.<br />
Comparison <strong>of</strong> the simulation and test results <strong>of</strong> discharge<br />
currents at 1 A and 4 A are shown in Fig. 5. As can be seen<br />
from the figure, a most satisfactory match between the model<br />
and test data has been obtained <strong>for</strong> the reference curve (2A)<br />
and while good agreement has also been obtained <strong>for</strong> all other<br />
discharge rates.<br />
TABLE I. SPECIFICATIONS OF LITHIUM BATTERY TESTED IN THIS PAPER<br />
Model Tested UltraLife UBBL10<br />
Type <strong>of</strong> <strong>Battery</strong><br />
Cylindrical 18650 Li-ion cells<br />
assembly<br />
Operating Temperature -32°C to 60°C<br />
<strong>Storage</strong> Temperature<br />
Range<br />
-32°C to 60°C<br />
Voltage 16.33 V<br />
Capacity 6.2 Ah<br />
Heat capacity 925(J/kg/K)<br />
Fig. 5. <strong>Simulation</strong> and test data at different current levels <strong>for</strong><br />
the Ultralife UBBL10 lithium-ion batter<br />
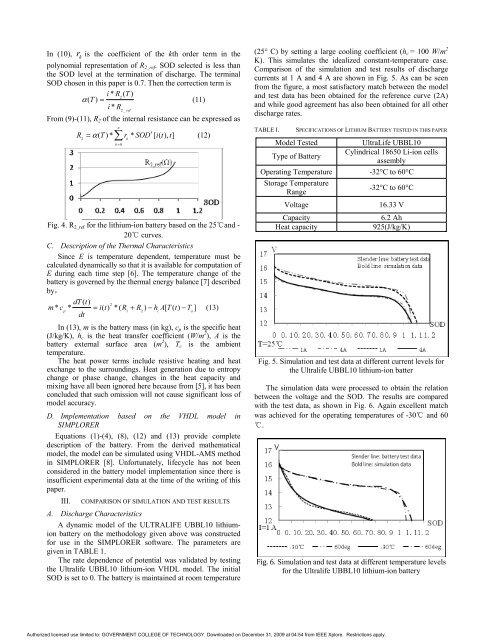
The simulation data were processed to obtain the relation<br />
between the voltage and the SOD. The results are compared<br />
with the test data, as shown in Fig. 6. Again excellent match<br />
was achieved <strong>for</strong> the operating temperatures <strong>of</strong> -30� and 60<br />
�.<br />
������� <strong>Simulation</strong> and test data at different temperature levels<br />
<strong>for</strong> the Ultralife UBBL10 lithium-ion battery<br />
Authorized licensed use limited to: GOVERNMENT COLLEGE OF TECHNOLOGY. Downloaded on December 31, 2009 at 04:54 from IEEE Xplore. Restrictions apply.