The Hungarian Communications Market Developments and ...
The Hungarian Communications Market Developments and ...
The Hungarian Communications Market Developments and ...

Create successful ePaper yourself
Turn your PDF publications into a flip-book with our unique Google optimized e-Paper software.
<strong>The</strong> <strong>Hungarian</strong> <strong>Communications</strong> <strong>Market</strong> <strong>Developments</strong> <strong>and</strong> Regulation between 2004 <strong>and</strong> 2008<br />
From the year 2004, the consumer price index has continuously increased,<br />
while the change of prices of electronic communications services<br />
remarkably fell behind. In fact, prices decreased in nominal terms.<br />
As a result, by the end of 2007, in real terms, prices of the electronic<br />
communications services were 25 percent lower than in 2003.<br />
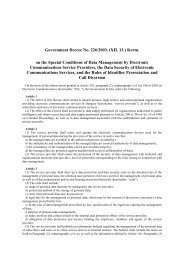
Figure 3.3: Per capita spending on telephone <strong>and</strong> Internet services<br />
per annum<br />
Thous<strong>and</strong><br />
HUF %<br />
50<br />
40<br />
30<br />
20<br />
10<br />
0<br />
Source: HCSO<br />
Telephone <strong>and</strong> Internet<br />
Proportion among total expenses<br />
2002 2003 2004 2005 2006<br />
In recent years, per capita spending on telephone <strong>and</strong> Internet<br />
services, according to the calculations of the <strong>Hungarian</strong> Central Statistical<br />
Office (HCSO), has continuously increased. Thus, spending in<br />
2006 was 73 percent higher in nominal terms <strong>and</strong> 33 percent higher<br />
7,5<br />
7,0<br />
6,5<br />
6,0<br />
5,5<br />
5,0<br />
4,5<br />
4,0<br />
in real terms than the 2002 figure. <strong>The</strong> ratio of per capita spending<br />
on telephone <strong>and</strong> Internet services within total per capita expenditures<br />
also increased to nearly reach as high as 7 percent in 2006.<br />
<strong>The</strong> reason for the spectacular increase in spending is not an increase<br />
in prices, but a remarkable growth in the volume of consumption.<br />
This is due, on the one h<strong>and</strong>, to the fact that more <strong>and</strong> more<br />
people use new communications services, e.g. mobile telephones<br />
<strong>and</strong> particularly the Internet <strong>and</strong>, on the other h<strong>and</strong>, to the increased<br />
usage of services, i.e. the traffic generated by individual costumers.<br />
Increase in the use of services within the different market segments<br />
varies: while dem<strong>and</strong> for fixed voice services is decreasing,<br />
the dem<strong>and</strong> for mobile telephony <strong>and</strong> especially for Internet services<br />
shows a strong increase.<br />
By analysing the effects of lower prices, it can be established that<br />
between December 2002 <strong>and</strong> December 2007 it was the spending<br />
of households with a fixed telephone line that has decreased to the<br />
highest degree, nearly by 20 percent. <strong>The</strong>re were only minor fluctuations<br />
in monthly expenditure associated with mobile telephony, with<br />
practically no significant changes until 2006. In 2007, however, they<br />
remarkably decreased, by nearly 7 percent. In 2007, the previous<br />
intensive growth in spending associated with cable television<br />
stopped. Although spending associated with the Internet increased<br />
by 33 percent until 2005, by the year 2007 it fell back to the 2002<br />
level. Nevertheless, that period saw a significant improvement in<br />
both service content <strong>and</strong> service quality, with the most spectacular<br />
development in the case of Internet. In 2002, Internet service mostly<br />
meant narrowb<strong>and</strong> dial-up connections. Nowadays costumers use<br />
almost only broadb<strong>and</strong> services.<br />
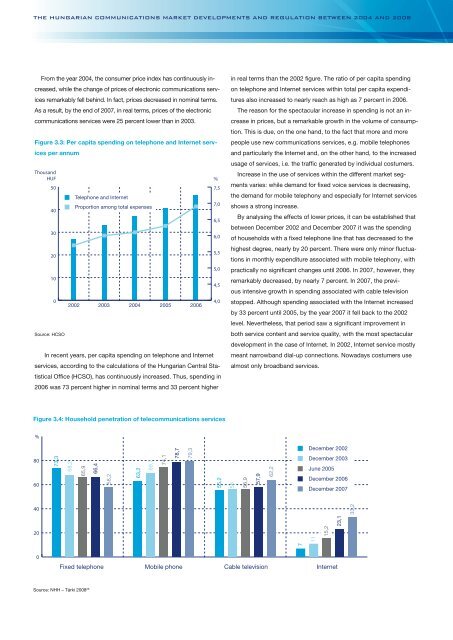
Figure 3.4: Household penetration of telecommunications services<br />
%<br />
80<br />
60<br />
73,3<br />
68,2<br />
65,9<br />
66,4<br />
58,2<br />
63,2<br />
69,7<br />
74,1<br />
78,7<br />
79,3<br />
55,2<br />
56<br />
55,9<br />
57,9<br />
62,2<br />
December 2002<br />
December 2003<br />
June 2005<br />
December 2006<br />
December 2007<br />
40<br />
23,1<br />
33,2<br />
20<br />
15,2<br />
7<br />
11<br />
0<br />
Fixed telephone Mobile phone Cable television Internet<br />
Source: NHH – Tárki 2008 25