The Hungarian Communications Market Developments and ...
The Hungarian Communications Market Developments and ...
The Hungarian Communications Market Developments and ...

Create successful ePaper yourself
Turn your PDF publications into a flip-book with our unique Google optimized e-Paper software.
46 47<br />
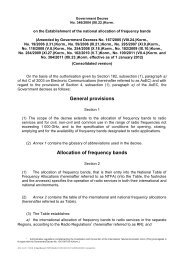
Figure 4.2: Voice traffic share of carrier selection<br />
Million<br />
minutes %<br />
3500<br />
3000<br />
Carrier selection call traffic<br />
Total voice traffic<br />
Carrier selection/total traffic (%)<br />
21<br />
18<br />
2500<br />
15<br />
2000<br />
12<br />
1500<br />
9<br />
1000<br />
6<br />
500<br />
3<br />
0<br />
0<br />
04/I.<br />
04/II.<br />
04/III.<br />
04/IV.<br />
05/I.<br />
05/II.<br />
05/III.<br />
05/IV.<br />
06/I.<br />
06/II.<br />
06/III.<br />
06/IV.<br />
07/I.<br />
07/II.<br />
07/III.<br />
07/IV.<br />
Source: NHH<br />
Traffic via carrier selection increased dynamically to exceed by<br />
fourteen percent of all fixed traffic by the end of 2005. Later on,<br />
however, such growth has stopped <strong>and</strong> the market position of those<br />
players competing via carrier selection stabilised at this level.<br />
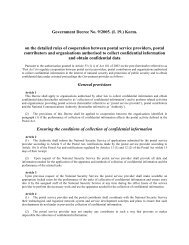
<strong>The</strong> effects of competition were remarkably reflected by retail<br />
prices. <strong>The</strong> average per minute tariffs, in all call directions, significantly<br />
decreased. <strong>The</strong> most impressive decrease was seen in local<br />
<strong>and</strong> domestic calls; by 2007 their price level was sixty percent lower<br />
than in 2004. <strong>The</strong> tariffs of international calls fell near thirty percent,<br />
while the tariffs of fixed-to-mobile calls fell ten percent during those<br />
three years.<br />
By 2004, alternative service providers obtained a significant share<br />
primarily in the business market of international calls. In 2005, however,<br />
competition soared in the residential market, where the share<br />
of incumbent service providers fell by more than twenty percent to<br />
around seventy percent in one year. <strong>The</strong>n, the loss of market share<br />
of service providers with SMP in the residential traffic market slowed<br />
down slightly. In the business markets, alternative service providers<br />
were able to steadily increase their market share.<br />
Figure 4.3: Per minute revenues of fixed traffic services<br />
HUF<br />
60<br />
50<br />
40<br />
30<br />
20<br />
10<br />
0<br />
Local<br />
Domestic<br />
International<br />
To mobile<br />
2004 2005 2006 2007<br />
Source: NHH