On the Surface
On the Surface
On the Surface

Create successful ePaper yourself
Turn your PDF publications into a flip-book with our unique Google optimized e-Paper software.
THISPAGEISNOTPARTOFSTERIS’S FORM 10-K FILING<br />
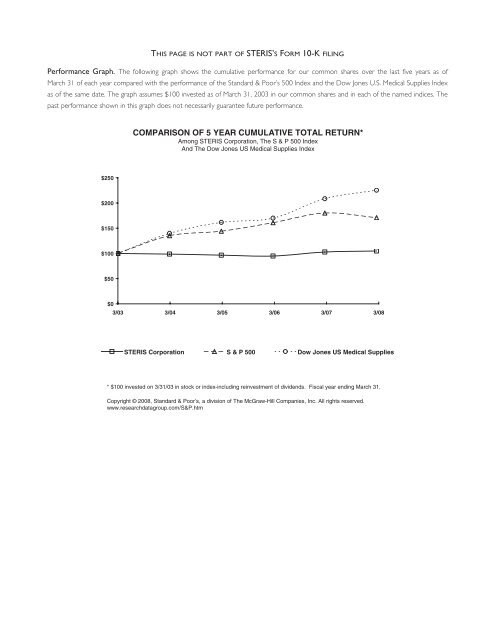
Performance Graph. The following graph shows <strong>the</strong> cumulative performance for our common shares over <strong>the</strong> last five years as of<br />
March 31 of each year compared with <strong>the</strong> performance of <strong>the</strong> Standard & Poor’s 500 Index and <strong>the</strong> Dow Jones U.S. Medical Supplies Index<br />
as of <strong>the</strong> same date. The graph assumes $100 invested as of March 31, 2003 in our common shares and in each of <strong>the</strong> named indices. The<br />
past performance shown in this graph does not necessarily guarantee future performance.<br />
COMPARISON OF 5 YEAR CUMULATIVE TOTAL RETURN*<br />
Among STERIS Corporation, The S & P 500 Index<br />
And The Dow Jones US Medical Supplies Index<br />
$250<br />
$200<br />
$150<br />
$100<br />
$50<br />
$0<br />
3/03 3/04 3/05 3/06 3/07 3/08<br />
STERIS Corporation S & P 500 Dow Jones US Medical Supplies<br />
* $100 invested on 3/31/03 in stock or index-including reinvestment of dividends. Fiscal year ending March 31.<br />
Copyright © 2008, Standard & Poor’s, a division of The McGraw-Hill Companies, Inc. All rights reserved.<br />
www.researchdatagroup.com/S&P.htm